

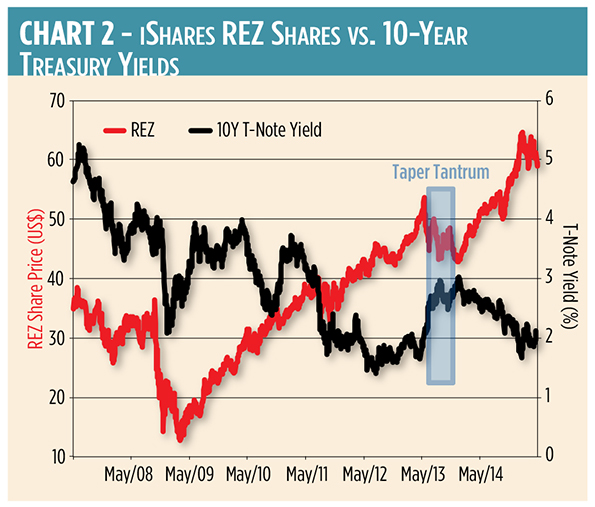
Since the so-called Taper Tantrum of 2013, real estate investment trusts (REITs) have been taking their cues from the Federal Reserve Board. Recall, the tantrum was when the market got spooked about the prospects of an abrupt withdrawal of Fed accommodation. Rates on the benchmark 10-year Treasury note shot up 135 basis points (82 percent) in just four months. (See Chart 2.)
The tantrum kicked off a big sell-off in bonds and bond-like investments such as REITs. And now, with the recent spike in interest rates, real estate investors are again worried that trust prices will tumble. By and large, those fears are justified. Four of the five top-performing REIT exchange traded funds swooned as Treasury rates ticked upward in April. One, however, actually gained ground. What accounted for the disparate performance? In two words: Global exposure.
Take a look at the top-tier REIT ETFs and how they fared against proxies for the S&P 500 Index (NYSE Arca: SPY) and the Barclays Aggregate Bond Index (NYSE: AGG) in Table 1.
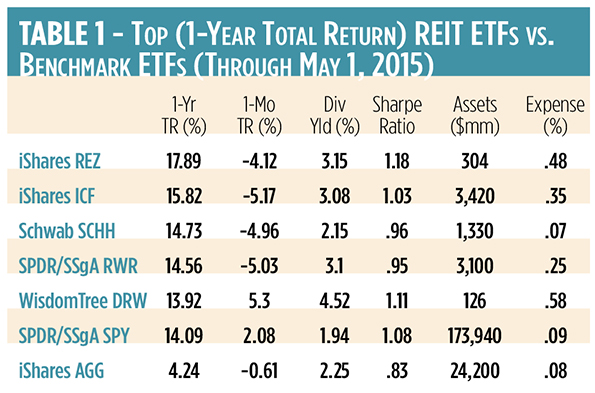
iShares Residential Real Estate Capped ETF (NYSE Arca: REZ) – This smallish fund has been the standout performer over the past 12 months. Perhaps the reason is its diversification. The fund tracks the FTSE NAREIT All Residential Capped Index, which—despite its name—only devotes about half of its asset weight to residential REITs. An equal part of the index portfolio is given over to a combination of self-storage, health care and hotel trusts. Of the top five funds, REZ is the least influenced by the broad stock market represented by the SPDR S&P 500 ETF (NYSE Arca: SPY) and is the most closely correlated to the fixed income market tracked by the iShares Core U.S. Aggregate Bond ETF (NYSE Arca: AGG).
Masters Portfolio
iShares Cohen & Steers REIT ETF (NYSE Arca: ICF) – This fund used to be known as the Cohen & Steers Realty Masters portfolio. “Masters,” in that context, meant “majors” or big players. The fund’s underlying index is a narrow compendium of committee-selected trusts. ICF is definitely a large-cap portfolio, devoting 6o percent of its exposure to its top 10 names. Commercial REITs comprise half of the asset base, with the balance more or less split between residential and specialized trusts.
Schwab U.S. REIT ETF (NYSE Arca: SCHH) – SCHH tracks the Dow Jones U.S. Select REIT Index, but at a fraction of the holding cost of its direct competitor. Boasting the lowest expense ratio in the segment, the fund invests in a diverse array of more than 80 domestic REITs. Still, the portfolio leans heavily toward commercial properties. SCHH has attracted a large asset base in the four years since its launch, aided by a fee which severely undercuts the 14-year-old SPDR/SSgA RWR portfolio tracking the same benchmark.
SPDR Dow Jones REIT ETF (NYSE Arca: RWR) – One of the oldest real estate ETFs on the market, RWR offers investors deep liquidity. RWR’s trading volume and bid/ask spreads outshine its SCHH doppelgänger. RWR, like SCHH, overweights commercial REITs, with specialized trusts such as health care and self-storage taking second billing. Traditional residential REITs make up a fifth of the portfolio.
WisdomTree Global Ex-U.S. Real Estate ETF (NYSE Arca: DRW) – DRW is the outlier of the top five portfolios in a couple of ways. First, its purview is strictly offshore. A quarter of DRW’s holdings are concentrated in Hong Kong; another quarter is split between Australian and French property trusts. A second distinction is its focus on dividend yield: DRW pays out 40 percent more than the next-best REZ fund. DRW, in fact, offers the highest yield in the REIT ETF segment.
Stark Contrasts
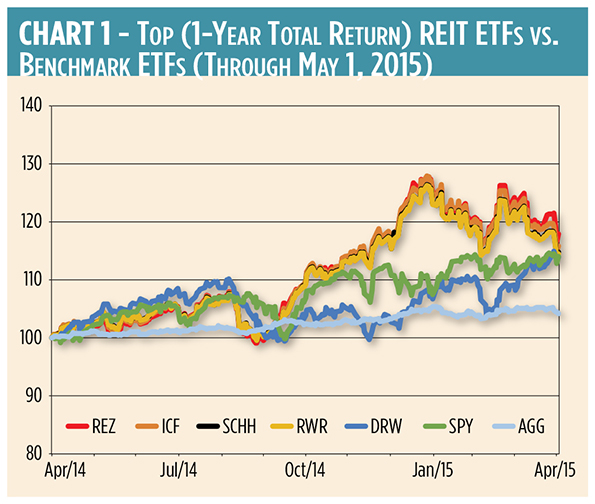
All told, the past 12 months have put two REIT ETFs in stark contrast to one other. On the basis of total return, the iShares REZ portfolio is far and away ahead of the pack. Still, since REZ is a portfolio that focuses on domestic property trusts, it moves more or less in lockstep with ICF and the RWR/SCHH twins. (See Chart 1.) DRW marches to a very different drumbeat. Sometimes DRW’s tempo causes the fund to trudge ahead of the domestic troops, sometimes to lag.
History May Provide Clues
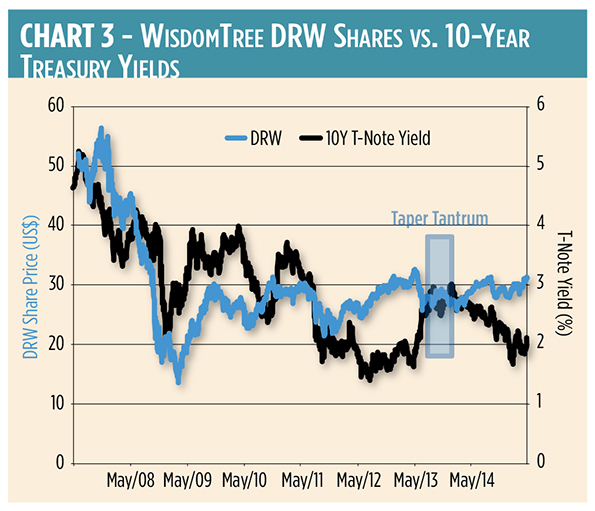
The question foremost in investors’ minds now is how future Fed actions (or the anticipation of action) will impact REIT values. History may provide some clues. Chart 2 highlights the effect of the 2013 Taper Tantrum on REZ’s share price. Over that year’s summer, REZ lost 18 percent, lending yet more credence to the “Sell in May, go away” axiom. At the same time, DRW dropped 16 percent. (See Chart 3.) So, should REIT investors take a cue to close out their REIT positions this summer?
Before Pushing Sell
Before pushing the “sell” button, investors should look at the performance of the two funds relative to 10-year note yields. Can you tell that that DRW had once been more closely correlated to domestic interest rates than REZ? Recently, that condition’s been reversed. As Fed accommodation has been withdrawn, the domestically focused iShares portfolio’s correlation has flipped and now outstrips that of DRW. (See Chart 4.)
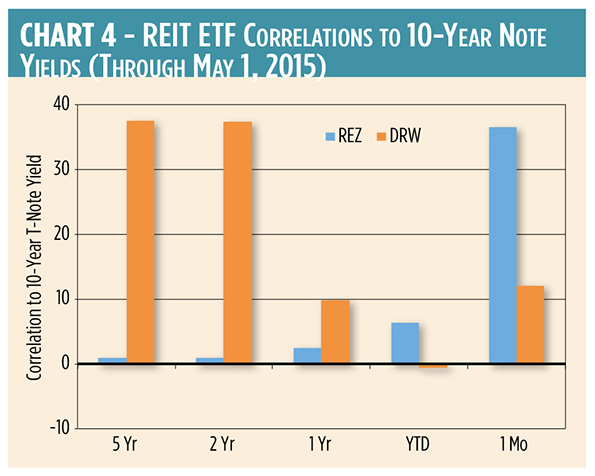
The implication? If REZ is a bellwether, it seems domestic real estate portfolios are becoming more sensitized to potential Fed action. In addition, the recent weakening of the U.S. dollar has given a boost to foreign-focused investments like DRW, magnifying the performance disparity.
That said, there seems little to be gained by fighting the Fed. But consider this: History shows that domestic REITs can actually hold up in a rising rate environment.
No doubt, rates will rise in the future. They can’t, after all, get much lower. What’s unknown is the timing and pace of the increase.
The Taper Tantrum—an event that anticipated a rate hike rather than reacted to one—was followed by substantial gains in REIT values. That’s not atypical. REITs, in fact, often gain ground after actual hikes in the federal funds rate. On average, REITs appreciated at an 11 percent annual rate over six tightening cycles dating back to 1979.
Driven by Capitalization
REITs tend to be driven more by capitalization (“cap”) rates than Fed-controlled tariffs. A cap rate reflects the yield earned from a property—essentially its net income divided by its market value. Economic growth rates and scarcity, rather than federal funds or Treasury yields, influence local investment returns. Rising Treasury yields and tighter monetary policy coincide with a recovering economy and heightened inflationary expectations. Historically, real estate values tend to appreciate, and cap rates decline, during such periods. Real estate investors typically accept lower cap rates with the expectation that price appreciation (read: inflation) leads to better cash flows from increasing occupancies and rents.
Let’s not forget that REITs, unlike fixed income securities, are inflation hedges—at least the well-run REITs with the pricing power to pass on rising costs to tenants. Time has shown that REIT cash flows and rents outpace inflation measured by the Consumer Price Index (CPI). Precursors of inflation—rising commodity prices and TIPS spreads—are already infiltrating the market. TIPS spreads goosed up 26 percent in April as commodity prices, measured by the Thomson Reuters/CoreCommodity CRB Index, climbed
9 percent.
The bottom line? There still appears to be room for REITs in investors’ portfolios. The safest route, though, seems a split strategy that divvies up the real estate allocation between domestic and foreign assets.


