

It was said that an Obama victory would cause inflation; a Romney win would be less inflationary. You could see the tug-and-pull in pre-election expectations most vividly reflected in the stalling of the daily Monetary Inflation Index (MII).
MII’s moniker is a throwback to inflation’s original meaning: a proliferation of coinage without a concomitant increase in the amount of circulating precious metal. Monetary inflation refers to the dilution of ancient coins’ intrinsic value—back when gold and silver were the currency of the day—by the alloy of precious with base metals. Such shenanigans were typical of unscrupulous rulers hoping to finance overly ambitious military adventures and social programs.
MII measures the gold purchasing power of the world’s foremost reserve currency—the U.S. dollar—compared to that of the euro, the second most widely held lucre. MII’s history traces back to the introduction of the euro in January 1999. By tracking the global value of the U.S. dollar, MII provides clues to price trends in certain financial assets.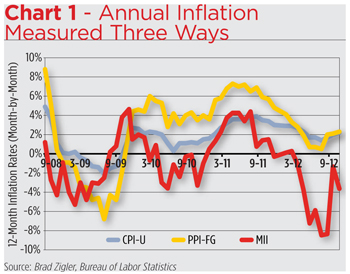
Most investors, however, see inflation through the prism of retail and wholesale goods prices, specifically as measured by the Consumer Price Index for All Urban Consumers (CPI-U) and the Producer Price Index for Finished Goods (PPI-FG). There’s a direct relationship between MII and the widely followed price indexes published by the U.S. Bureau of Labor Statistics, though MII is certainly more volatile. Changes in MII’s annual inflation rate often predict variances in the velocity of CPI/PPI. Note, for example, the shape of the inflation curves in Chart 1. The March 2009 bottoming in the MII rate preceded nadirs in CPI and PPI by three full months.
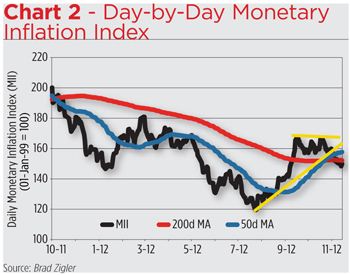 Because MII is based on readily accessible market values for gold and euros, it can be calculated on a daily basis. This real-time availability allows investors and advisors to better chart the course of inflation without the six-week delay that’s baked into the monthly CPI and PPI values. Regard, for example, the congestion in the daily MII readings in the run-up to the November election. Chart 2 shows MII reaching a plateau in September after being propelled from a summer bottom by the implementation of the Fed’s Operation Twist. There was, to boot, a bullish cross of MII’s 50-day moving average over its 200-day mean. Technicians will recognize these patterns as predictors of a potential upside breakout in the inflation index. MII was telegraphing, in essence, an inflationary condition, i.e., a slump in the value of the greenback, to the election.
Make sure you emphasize that word “potential.” After enough votes were tallied to yank the White House welcome mat from under Mitt Romney, the daily MII readings actually broke to the downside of the congestion area and whistled through the moving averages, leaving investors and advisors to wonder if there’s a strong dollar (read: lower MII) or weak dollar (higher MII) environment ahead.
So, just what are the post-election odds of inflation? And how should investors gird themselves if it reappears in earnest? Let’s look at the odds first.
By the Numbers
Over the past year, MII ranged between 195.17 and 119.46. (Keep in mind that the index began life in January 1999 at 100.) Index volatility was most recently clocked at 27.2 percent per annum. With that in mind, we can apply a little probability theory to derive MII’s likely parameters for the coming year. The likelihood of MII breaking through its 2012 boundaries are laid out in Table 1. (This article was prepared before year-end 2012.)
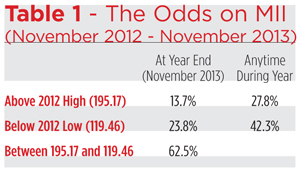 While Chart 2 clearly illustrates MII’s 2012 downtrend, Table 1 looks out to next November, revealing just a 1-in-8 chance that inflation will trend above its 2012 high. Ending up under last year’s low is nearly twice as likely.
Still, a bookmaker would lay 5-to-8 odds that MII finishes the year somewhere between these marks. And knowing that, the option trader in me says to sell inflation strangles (out-of-the-money calls and puts). There seems to be little chance of making money with inflationary bets over the next 12 months.
No MII options are, as yet, extant, so what’s an investor to do?
Well, the first thing is to recognize that our probability distribution is just that—an array of possibilities, not guarantees. Anything can happen over the next 12 months. Perhaps the best approach, then, is to use the table as an allocation template. Maybe 13 percent of one’s portfolio ought to be devoted to inflation hedges.
TIPping the Scale
Mention “inflation” to a savvy investor nowadays and, more than likely, TIPS will typically crop up on his or her short list of hedges. This makes sense since the principal value of Treasury Inflation-Protected Securities adjust to accommodate changes in CPI-U, i.e., inflating apace with an upward CPI trend to protect the holder’s purchasing power. Aside from individual issues, there are now more than a dozen TIPS-based exchange-traded funds.
With 80 percent of the category’s assets, the granddaddy of TIPS products is still the iShares Barclays TIPS Bond Fund (NYSE Arca: TIP). The fund’s underlying index includes all publicly-issued U.S. Treasury inflation-protected securities that have at least one year remaining to maturity and have $250 million or more of outstanding face value.
The recent disinflationary environment has taken a toll on TIPS yields, though the iShares fund still managed to post a year-to-date gain of nearly 7 percent through mid-November. That’s a full percentage point better than the S&P 500’s total return with just a third of the risk.
Remarkably, given TIP’s skew to the short end of the curve, investors in the inflation-linked product have fared better than those favoring conventional Treasury securities. This year, TIP outperformed both the iShares Barclays 7-10 Year Treasury Bond Fund (NYSE Arca: IEF) and the iShares Barclays 10-20 Year Treasury Bond Fund (NYSE Arca: TLH) on a total return basis.
 Going forward, though, Treasury investors will need to be mindful of the break-even inflation (BEI) rate to determine the viability of a TIPS commitment. The break-even inflation rate is the difference between the nominal yield on a conventional bond and the real yield on an inflation-protected investment of similar maturity. If inflation averages more than the break-even rate, TIPS will outperform vanilla bonds. Conversely, if inflation stays below the break-even rate, conventional paper will outperform inflation-linked notes.
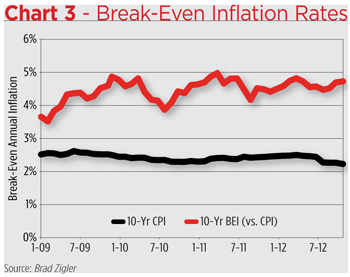
 Over the past three years, as illustrated in Chart 3, CPI has been steadily grinding downward. At last look, the 10-year average for CPI was 2.2 percent. The implied 10-year BEI, meanwhile, stood at a relatively lofty 4.7 percent in October. The more daylight between CPI and BEI, the less threat—in the market’s perception at least—of an inflationary bout. That daylight, in fact, has been glowing ever more brightly since summer. In June, the spread was 2.1 percent; by October it widened to 2.5 percent.
Hedges Aren’t Just for Houses
Still think you need an inflation hedge? Well, a 1-in-8 chance is still a chance. There are other assets to consider. Take real estate, for example.
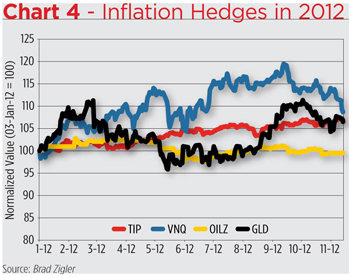
With 55 percent of its category’s assets, the Vanguard REIT ETF (NYSE Arca: VNQ) is clearly the top dog. VNQ, year to date, has handily outdone TIPS, long bonds and stocks, but is not only more closely correlated to the S&P 500 than the other assets we’ve considered so far (see Table 2), it’s been largely more volatile. That’s made VNQ a zero-alpha investment.
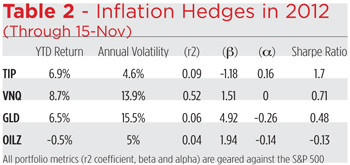 What of that perennial (or perennially-touted) inflation hedge, gold? The SPDR Gold Trust (NYSE Arca: GLD), holding 73 percent of its category’s assets, is the definitive exchange-traded gold product. GLD gained nearly as much as TIP this year, but its high volatility led to negative alpha.
Over the past few years, the greatest source of consumer price inflation has undeniably been oil. It’s safe to say that, at times, oil IS inflation. Though it represents less than 1 percent of its category’s assets, the UBS E-TRACS Oil Futures Contango ETN (NYSE Arca: OILZ), featured in our August 2011 issue (“Can The New Oil ETP Tame Contango, the Roadblock to Commodity Futures Profits?,” http://bit.ly/Qlhnsv on WealthManagement.com, REP.’s website), is the exchange-traded product most likely to accurately track the cash value of crude oil. Oil’s been a bit of bust as a buy-and-hold investment this year, reflected by the negative return for OILZ. Oddly, though, that’s actually a recommendation for OILZ as an inflation hedge. OILZ, CPI and MII have been fellow travelers, each grinding lower as the year wound down. The question before investors and advisors now is whether OILZ will track higher when CPI and MII uptrend.
The Last Word
All these inflation hedges have the potential to appreciate in price, whether or not the central bank continues to keep the liquidity spigots open. They can do well, too, if stocks or conventional Treasuries drift in search of a trend. One thing is certain, though. In 2012, TIPS, accessed through the iShares ETF, has been the most efficient inflation-sensitive play. We’ll have to see if they can hold on to that distinction in 2013.