(Bloomberg View) -- Inequality in the U.S. depends on how you look at it: Some groups of rich households, for example, have fared much differently than others. Such nuances are crucial in understanding the phenomenon -- and what policy makers should do about it.
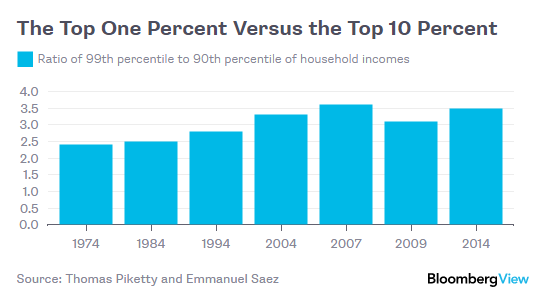
Let's start by focusing on the income of the top 1 percent of Americans, compared to that of the top 10 percent. As of 2014, a household needed an annual income of at least $423,090 to be in the first group, about 3.5 times the threshold for the second group, according to data compiled by the economists Thomas Piketty and Emmanuel Saez. That's close to the largest difference on records going back to 1974, with one exception: The gap was bigger just before the recession of 2007-2009, during which it fell sharply. Here's a chart:
Now let's look at the top 10 percent of households. As of 2014, the minimum income for the group was $157,479, according to the Census Bureau. That's about 2.9 times the income of households in the middle of the distribution. This measure of inequality has grown more or less steadily over the past four decades, with no pause for the recession. Here's a chart:
Both trends matter, but the contrast suggests different drivers. The top 1 percent, for example, includes a lot of entrepreneurs -- a feature that may explain why incomes in the group were so much more sensitive to the recession. Households in the rest of the top 10 percent consist largely of wage earners, so inequality between them and the median household is probably driven by a divergence in pay.
The message for policy makers: If they want to address inequality, they will have to take a nuanced approach, recognizing that both the top 1 and 10 percent contribute to the phenomenon, and that incomes at the very top are highly volatile. They might, for example, want to raise tax rates on the top 10 percent compared to the middle, but be more careful about any further increase in marginal rates on the top 1 percent, considering the importance of entrepreneurship in generating jobs and growth.
One final observation: As of 2014, the median household income, adjusted for inflation, was still lower than in 2007. So was the minimum income of the top 10 percent and the top 1 percent. Even the very high minimum income for the top 0.1 percent was a remarkable 20 percent lower in 2014 than in 2007. This eloquently illustrates the main public policy story of the past 10 years: The failure to stem the last recession and stimulate a more robust recovery has harmed all Americans, including the rich.
This column does not necessarily reflect the opinion of the editorial board or Bloomberg LP and its owners.
To contact the author of this story: Narayana Kocherlakota at [email protected] To contact the editor responsible for this story: Mark Whitehouse at [email protected]
For more columns from Bloomberg View, visit bloomberg.com/view


