It’s probably no surprise to you that technology stocks have been on a roll this year. Broad-based tech indexes have doubled or trebled the returns earned by the S&P 500. Though not all tech indexes are built alike. If you’re an index fund investor, the difference between being happy and very happy with your tech returns in large part is due to the benchmark tracked by your portfolio.
Three exchange traded funds dominate the broad tech sector: the Technology Select Sector SPDR (NYSE Arca: XLK), the iShares U.S. Technology ETF (NYSE Arca: IYW) and the Vanguard Information Technology ETF (NYSE Arca: VGT). All track market cap-weighted indexes.
XLK’s portfolio is carved out of the S&P 500 and includes 76 large-cap stocks. About 62 percent of its market cap is concentrated in its top 10 companies. IYW tracks the Dow Jones U.S. Technology Index, a 137-stock benchmark with about 10 percent of its portfolio invested in mid-cap companies. About 67 percent of IYW’s weight is committed to its top 10 issues. VGT’s reach into the tech sector is the broadest of all. Its 353-stock portfolio replicates an MSCI index, which devotes nearly 18 percent of its capital to mid-caps and even a tiny fraction to small-caps. Its top 10 stocks, accordingly, take up only 55 percent of the ETF’s heft.
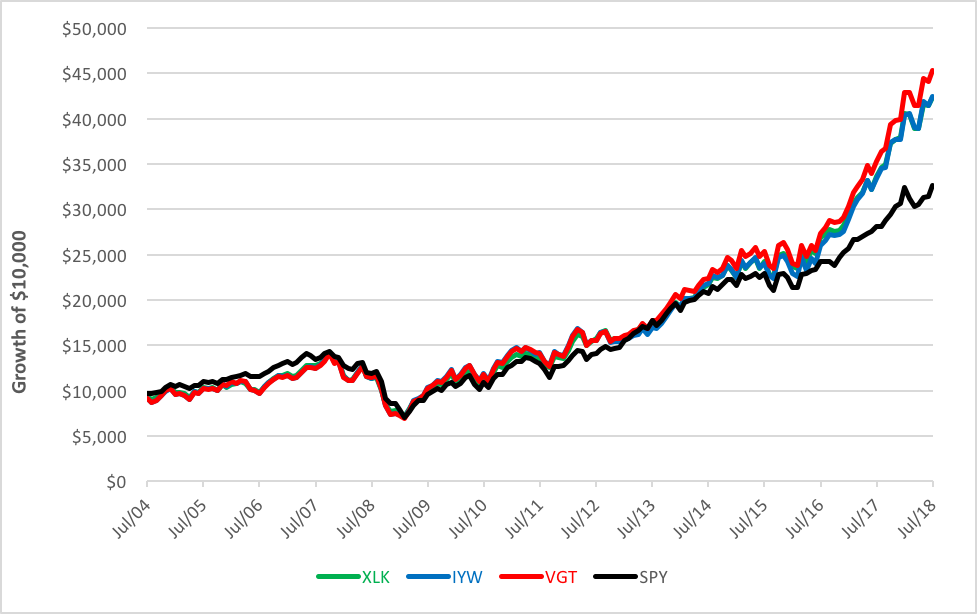
If you look back at the returns of these tech ETFs versus that of the broader market proxied by the S&P 500 SPDR ETF (NYSE Arca: SPY), you’ll see they pretty much hugged the broad market for a decade (see the chart below). Then, daylight starts to appear, separating their gains from that of the S&P.


So what happened? After all, these tech ETFs, despite the disparity in the number of their holdings, own large positions in pretty much the same stocks. And in like proportion. Indeed, SPY does too. There’s something else going on. But what?
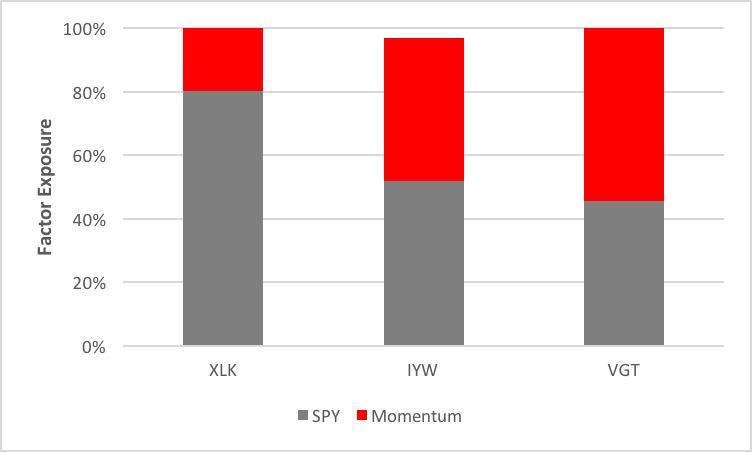
For the answer, we looked into the funds’ factor exposures benchmarked against SPY. Evaluating tech ETFs is fairly easy. Tech stocks are momentum issues. They’re growth personified. The question is, how much exposure to the momentum factor does each fund have?

Momentum describes the rate of acceleration in the price of a stock. Momentum traders look for investment opportunities created by a stock’s latest price break in an attempt to ride the middle portion of a trend when a stock’s price is moving at its maximum velocity.
Upon analysis, we find that XLK’s exposure to the momentum factor pales in comparison to its tilt toward SPY. No surprise there, given the provenance of XLK’s component stocks. The other funds tilt more heavily towards momentum. In fact, momentum makes up the majority of VGT’s factor exposure. That goes a long way to explain the fund’s overperformance.
And, as a cautionary note, that should be a warning of potential underperformance when the tech sector heads south.
Brad Zigler is WealthManagement’s Alternative Investments Editor. Previously, he was the head of Marketing, Research and Education for the Pacific Exchange’s (now NYSE Arca) option market and the iShares complex of exchange traded funds.


