Based on my experience of spiraling prices in the '70s and '80s, I never thought I'd be rooting for inflation but I am. Mildly.
I'm not alone. Our estimable Fed chair, Janet Yellen, is also hoping for inflation. Oh, how she hopes. Unfortunately, inflation — at least the Fed's favorite kind — is lagging. The latest release from the Bureau of Economic Analysis showed a sluggish 1.6 percent annual growth rate in the core PCE (Personal Consumption Expenditures) metric. The Fed targets a 2 percent inflation rate.
Core inflation is the Fed's favored measure because it excludes price changes in the most volatile items, namely food and fuel. Core inflation is more stable and, presumably, more predictable. You can see how stable the growth rate is in the chart below. Over the past three years, core PCE has averaged an annual growth rate of 1.5 percent while the core CPI (Consumer Price Index) has increased at a 2 percent pace.
Core Inflation Indices (Cumulative Month-to-Month)

The trouble with these numbers is their staleness. The latest available PCE numbers reflect economic conditions as of April. Two months ago. For investors, and especially traders, relying on core PCE is a lot like using just your rearview mirror to guide your car down the road.
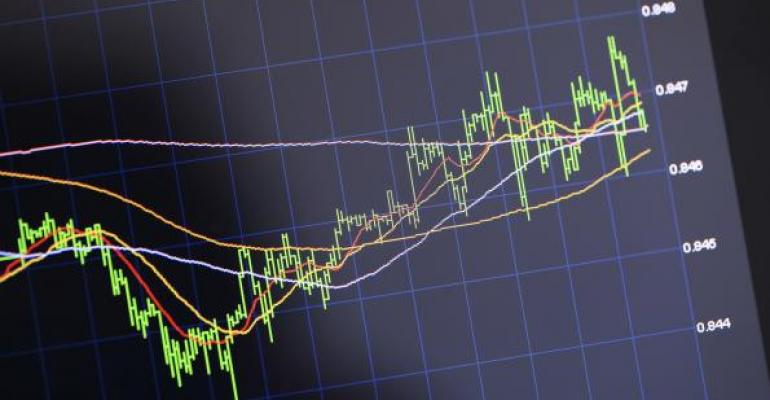
There's an indicator, however, that can give you an instant read on the current inflation environment. If you index the price ratio of SPDR S&P 500 ETF (NYSE Arca: SPY) to the Wisdom Tree Continuous Commodity Index ETF (NYSE Arca: GCC), you'll get a day-by-day look at inflation's momentum.
SPY represents a broad-based portfolio of blue-chip stocks while GCC tracks an equal-weighted index of 17 commodity futures. The rationale for the index is simple. Inflation's likely to show up in commodity prices well before it's expressed in retail goods. When that happens, traders are likely to favor commodities over securities.
You can see from the chart below that inflation's momentum, after a two-year downtrend, is now bottoming. In fact, there's been a bullish cross of the indicator's 50-day moving average over its 200-day average.
It's early days yet, but I smell inflation brewing.
Daily Inflation Trend Indicator


