
“Close” may be good enough for horseshoes and hand grenades, but it just doesn’t cut it for exchange-traded product (ETP) returns. Investors and their advisors are often surprised by the disparate results obtained from their exchange-traded note and fund allocations. The surprises are most often unpleasant and most especially associated with commodity based products.
So, what accounts for the variances between actual commodity returns and those earned by ETPs? The answer’s found in a single letter,“C.” Well, truthfully, it’s “C” times three: composition, contango and compounding.
Composition
Commodity exposure is a many-splendored thing: There’s more than one way to obtain it. Like their equity brethren, broad-based commodity benchmarks differ in their compositions and weightings. Among the most widely followed commodity indexes are:
Dow Jones-AIG Commodity Index: This index can be accessed through a Barclays Bank-issued iPath note (NYSE Arca: DJP). Made up of 19 futures, weighted primarily for trading volume and secondarily based on global production; energy carries the topmost weight, followed by metals, agriculturals, soft commodities and livestock.
The S&P/Goldman Sachs Commodity Index is a production-weighted benchmark of two dozen commodities adjusted for liquidity and investability. Currently, the SP/GSCI is most heavily weighted in energy products. Investment in the index can be proxied through a Blackrock-managed iShares fund (NYSE Arca: GSG), an iPath note (NYSE Arca: GSP), or, in modified form, through an exchange-traded note issued by Goldman Sachs (NYSE Arca: GSC).The Deutsche Bank Liquid Commodity Index: Comprised of 14 commodities, all purported to be the most liquid in their respective sectors, DBLCI is most heavily weighted in energy, then agriculturals and metals. There’s no exposure to livestock within DBLCI. A dual rebalancing policy is designed to maximize the return, or minimize the costs, of rolling futures forward (more on that later). DBLCI underlies the PowerShares DB Commodity Index Tracking ETF (NYSE Arca: DBC).
The Rogers International Commodity Index, the broadest and most international of the benchmarks, consists of 38 commodities. Weights are determined by a commodity’s importance in international trade, with energy given the heaviest tilt, followed by agriculturals, softs, metals and livestock. An exchange-traded note tracking RICI (NYSE Arca: RJI) is offered under the ELEMENTS brand.
The Continuous Commodity Index is, in fact, the original Commodity Research Bureau Index -- the great granddaddy of commodity benchmarks. The index is made up of 17 equal-weighted futures contracts. Sector wise, agriculturals and softs are the heftiest, comprising nearly half the benchmark’s weight. Metals make up about a quarter, with energy and livestock splitting the balance. The GreenHaven Continuous Commodity Index ETF (NYSE Arca: GCC) provides access to the benchmark.
The UBS Bloomberg Constant Maturity Commodity Index can be accessed through an ETN issued by UBS (NYSE Arca: UCI). The index tracks the returns from a basket of 28 commodity futures covering the energy, metals, agricultural and livestock sectors. Component futures are diversified across five constant maturities ranging from three months up to three years.
Although each index-tracking product proxies the tradeable commodity universe, they convey distinctly different risks. The heavy emphasis on energy in most of the underlying indexes, in particular, increases their volatility. (There’s a reason the Bureau of Labor Statistics excludes energy prices from its calculation of “core” inflation, you know.)

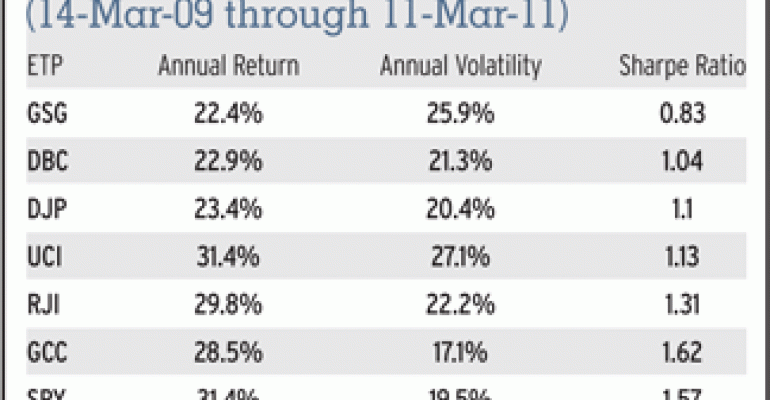
Most, but not all. The equal-weighting scheme of the Continuous Commodity Index underlying the GCC fund downplays energy’s influence to yield the highest risk-adjusted return over the past two years. GCC’s Sharpe ratio is, in fact, higher than that of the equity market bellwether, the SPDR Depository Receipt (NYSE Arca: SPY), a distinction that can’t be claimed by any other broad-based commodity product examined here. (See Table 1.)
While we’re on the subject of energy, let’s look at the other “C” that besets investors in the petroleum market -- contango.
Contango
Contango refers to the premium built into the price of deferred delivery contract. When, for instance, April crude oil trades for $101 a barrel and May sells at $103, there’s said to be a $2 contango. Contango reflects the costs of carrying oil inventories until their delivery month -- namely, storage, insurance and financing. For a storable commodity such as oil, the existence of contango denotes surplus. Contango tends to widen when supplies abound and/or demand slackens.
Contango markets are unloved by holders of long-only index products because of the negative yield encountered when expiring contracts are replaced by forward-month deliveries. Index funds, of course, must maintain constant exposure to their component futures. Holding futures into an expiration month creates a delivery risk, so part of a commodity index’s methodology specifies protocols for rolling futures positions forward. To roll a long position, the soon-to-expire contract is sold as the distant delivery is simultaneously purchased.
A contango adds to the cost of long index exposure. If, for example, April crude has to be sold for $101 and May bought at $103, there’s a $2 loss that must be made up just to break even. The oil market has been in contango since the market meltdown of 2008, resulting in subpar returns for long-only energy allocations -- that is, compared to spot oil prices.
While contango is a bane to long index portfolios, it’s a boon to funds and notes based upon short, or inverse, exposures. It’s not hard to see why. To roll a short position forward, you must buy back the cheaper nearby contract while selling the more costly deferred futures. The positive roll yield enhances the index return.
That sets up an inequality between dedicated short notes and funds and their long-only siblings. They’re not mirror images. You won’t get the same results from buying an inverse product as you would by selling short its opposite number. Part of that’s due to contango’s effect. But for some instruments, it’s a matter of construction as well.

As an example, look at a pair of exchange-traded notes issued by Deutsche Bank which track oil subsets of the Deutsche Bank Liquid Commodity Index (DBCLI). The PowerShares DB Crude Oil Long ETN (NYSE Arca: OLO) is based upon the Optimum Yield version of DBLCI which attempts to optimize roll returns by “shopping” for the most advantageous swap. In other words, the notes track an index that attempts to minimize contango’s effect. The short ETN, however, is based upon a standard version of DBLCI. There’s no optimization built into the index methodology.
Plotting the notes’ performance against spot oil (Chart 1) reveals the real-world impact of the oil market’s contango. First of all, the spread between the spot oil return and that of the long note, even with the yield optimization is substantial -- 26.8 percent for spot and only 14.4 percent for the note.
There’s a substantial difference, too, between the absolute value of the short note return and oil’s. The short note’s loss was -12.5 percent, 1.9 percent less than would be expected if SZO and OLO were polar opposites.
Compounding
This brings us to the third “C”: compounding. Compounding can account for some unexpected variance from index returns, especially when leverage is introduced. Take, for example, the effect of compounding in the pricing of the ProShares Ultra DJ-UBS Commodity ETF (NYSE Arca: UCD).
The fund aims to deliver twice the daily performance of the Dow Jones-UBS Commodity Index. And it does, more or less. In the past year, the Dow Jones UBS Commodity index rose 22.4 percent while the market value of the ProShares fund climbed 43 percent. UCD’s aim seems a little off, but you have to remember the key word “daily” in its stated objective.
The lag in UCD’s performance can be accounted for in two ways. First, there’s a timing error. If you follow only the last sale price, rather than the midpoint of the current bid-ask spread, you’re going to see more dramatic variance from the index return.
An ETP’s market maker is obliged to update prices at least every 15 seconds; trades aren’t scheduled like that. There can be a considerable timing gap between a price update and a trade. For UCD, the timing error has ranged from a premium of 3.1 percent to a discount of 4.5 percent. For the unlevered DJP note, the range of the apparent pricing error is a lot narrower: 1.3 percent to -1.3 percent.
The second factor contributing to a performance gap is the genuine tracking error -- that is, the differential attributed to frictional transaction costs and portfolio fees. Transaction fees include bid/ask spreads, commission costs and slippage associated with the management of an exchange-traded fund portfolio (lacking an underlying portfolio, exchange-traded notes are devoid of such costs). Portfolio fees include management overhead -- typically, the annual expense ratio charged against an ETF and the investment fee levied against the return of an ETN.

But even if an ETP were perfect—that is, produced no tracking error— the compounding of returns would still produce significant variance from its expected return. Remember, the objective of the levered fund is to provide a multiple of the underlying index’s daily return. As you can see from Chart 2, UCD’s leverage caused its return to cross above and below that of the index-hugging DJP note’s over the past year.
Imagine buying UCD shares at $38 just ahead of a five-day run of 1 percent gains. Compounding the returns over five days (found mathematically as $38 x 1.015) would put UCD at $39.94. That’s 4 cents more than a simple 5 percent accretion (determined as $38 x 1.05). Stretch that disparity out over a longer time frame and you've got yourself a real spread. Make the daily returns negative and the under-performance becomes equally dramatic—the compounding effect in reverse.
Conclusion
A final “C” here -- the conclusion. “Cs” have long been used to gauge an investment’s qualities. Just ask any jeweler. You can’t guarantee an ETP will be a gem by assessing its “Cs,” but you stand a much better chance of making a sterling investment decision if you do.


