Don’t you just love it when a plan comes together? Well, there’s a plan afoot to push crude oil prices higher. And you needn’t look for dark conspiracies for evidence of this. There’s a trail—in fact, two trails —in plain sight.
First, there’s the crude oil cash-and- carry trade which officially died Thursday, at least for the U.S. benchmark West Texas Intermediate (WTI) market. WTI, traded on Nymex as Crude (Light), is a less viscous and less sulphurous grade favored for gasoline production.
The cash-and-carry has been a big oil trader’s piggy bank, off and on, for the past year and a half. In that time, as interest rates languished at generational lows, risk-free (well, virtually risk-free) returns in fat double digits have been snagged.
Case in point: back in February, when the spot price of WTI caved in to the $26 level, traders could snatch up a cargo of crude for cash, store it (if storage space could be found) and lock in a sale price three months hence simply by shorting WTI May futures.
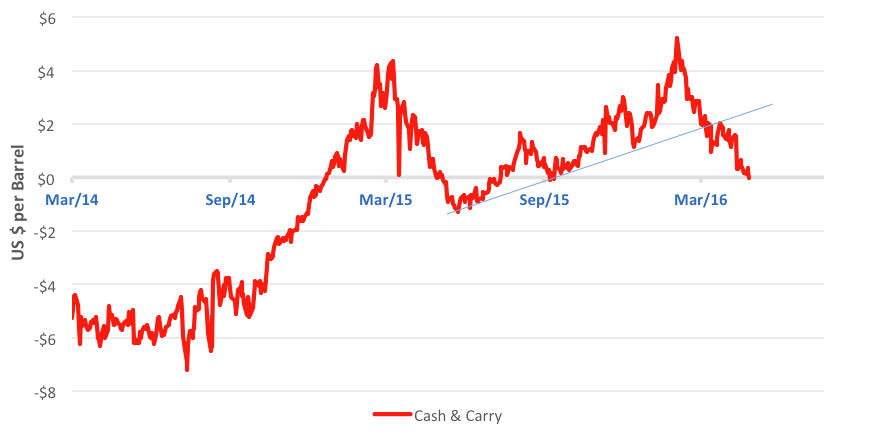
The math’s simple: buy crude at $26 a barrel, pay less than a buck per barrel for storage and interest, and sell the cargo for $32 a barrel through futures. That’s a $5 net profit per barrel or nearly 20 percent for three months’ work, if you could call this work. And what could your money earn at a bank? Well, in February three-month commercial lending rates were a paltry 60 basis points—per annum!—for the best credits.
Since February, though, the carry trade’s been in a slump as WTI’s price rebounded. Thursday, the carry finally turned negative. The bank’s now closed.
That “now” may last a while if you regard a second trail. Thursday also marked a bullish crossover in the spot WTI price as its three-month simple moving average (SMA) crossed above the six-month trail for the first time in nearly two years.
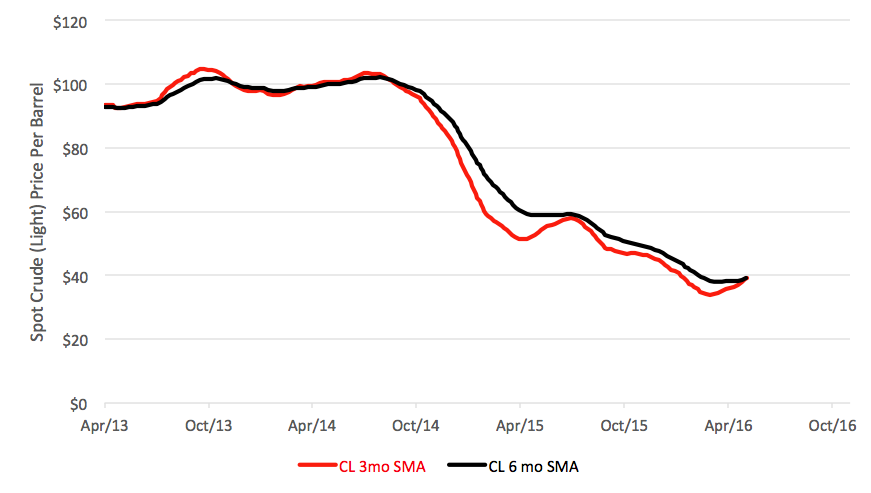
This simple indicator’s a pretty good predictor of bull market potential. There have been a half-dozen bullish crosses since mid-2009, marking cycles averaging 151 trading days. Start-to-peak gains averaged 16.3 percent in these rotations.
With leverage at 10:1 or so, position traders can get a whole lot of bang out of a 16.3 percent price hike. But there’s a whole lot more risk absorbed by trying to capture such gains. Trading the oil market is very different than banking on the oil market.
Brad Zigler is REP./WealthManagement's Alternative Investments Editor. Previously, he was the head of marketing, research and education for the Pacific Exchange's (now NYSE Arca) option market and the iShares complex of exchange traded funds.