
This report focuses on my top picks and pans for all sector funds. I will follow this summary with a detailed report on each sector.
My top ETFs and mutual funds have high-quality holdings and low costs. As detailed in “Low-cost funds dupe investors”, there are few funds that have both good holdings and low costs. While there are lots of cheap funds, there are very few with high-quality holdings.
I think there are at least two causes for this disconnect. First, there is, in general, a lack of independent research on ETFs and funds. Second, I think it is fair to say that there is a severe lack of quality research into the holdings of mutual funds and ETFs. There should not be such a large gap between the quality of research on stocks and funds, which are simply groups of stocks.
After all, investors should care more about the quality of a fund’s holdings than its costs because the quality of a fund’s holdings is the single most important factor in determining its future performance.
My Predictive Rating system rates 7400+ ETFs and mutual funds according to the quality of their holdings (Portfolio Management Rating) and their costs (Total Annual Costs Rating).
Figures 1 shows the best ETF or mutual fund in each sector as of January 13, 2014.
For a full list of all ETFs and mutual funds for each sector ranked from best to worst, see my free ETF & mutual fund screener.
Figure 1: Best ETF or Mutual Fund In Each Sector
 Source: New Constructs, LLC and company filings
State Street SPDR Consumer Staples Select Sector SPDR (XLP) is my highest-rated Consumer Staples ETF and earns my Attractive rating. XLP allocates over 39% of its asets to Attractive-or-better rated stocks and has low annual costs of only 0.20%.
The Kroger Company (KR) is one of my favorite companies held by XLP and earns my Attractive rating. KR has grown after-tax profit (NOPAT) by 23% compounded annually over the past decade. Its soon to be completed acquisition of Harris Teeter (HTSI) should be a further boost to growth. At the $2.4 billion acquisition price, HTSI will boost KR’s return on invested capital (ROIC) while also giving it a greater geographic reach. Despite KR’s consistent profit growth, the market has low expectations for its future cash flows. At its current valuation of ~$39/share, KR has a price to economic book value ratio of 0.8, which implies that the market expects a permanent 20% decline in after-tax profit (NOPAT) for the grocery chain. KR should comfortably exceed those pessimistic expectations and reward investors.
Figure 2 shows the worst ETF or mutual fund for each sector as of January 13, 2014.
Dangerous-or-worse-rated funds have a combination of low-quality portfolios (i.e. they hold too many Dangerous-or-worse rated stocks) and high costs (they charge investors too much for the [lack of] management they provide).
Figure 2: Worst ETF or Mutual Fund In Each Sector
 Source: New Constructs, LLC and company filings
Saratoga Advantage Trust: Energy and Basic Materials Portfolio (SBMBX) is my worst-rated Energy mutual fund and earns my Very Dangerous rating. SBMBX allocates over 46% of its assets to Dangerous-or-worse rated stocks and has high total annual costs (TAC) of 6.02%.
Noble Energy, Inc. (NBL) is one of my least favorite stocks held by SBMBX and earns my Very Dangerous rating. Noble Energy has only grown NOPAT by 2% compounded annually over the previous six years and currently earns a fourth-quintile ROIC of only 7%. The company has also generated negative economic earnings for the past four years. Worse yet, NBL is highly overvalued. At its current price of ~$65/share, the market expects NBL to grow NOPAT by 16% compounded annually over the next 11 years. These are high expectations for a company that has only grown NOPAT by 2% over the last six years. Investors should steer clear of NBL.
Traditional mutual fund research has focused on past performance and low management costs. The quality of a fund’s holdings has been ignored. Our Portfolio Management Ratingexamines the fund’s holdings in detail and takes into account the fund’s allocation to cash. Our models are created with data from over 50,000 annual reports. This kind of due diligence is necessary for understanding just what you are buying when you invest in a mutual fund or an ETF.
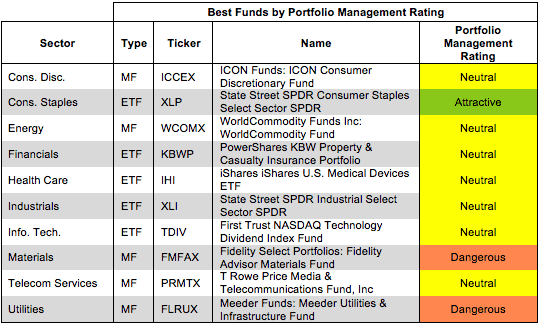
Figure 3 shows the best ETF or mutual fund based on our Portfolio Management Rating for each sector as of January 13, 2014.
Attractive-or-better-rated funds own high-quality stocks and hold very little of the fund’s assets in cash – investors looking to hold cash can do so themselves without paying management fees. Less than 1% of funds receive our Attractive or Very Attractive Portfolio Management ratings, so investors need to be cautious when selecting a sector mutual fund or ETF – over 799 sector funds earn my Neutral-or-worse-rating.
Figure 3: ETF or Mutual Fund With Highest Quality Holdings by Sector
 Source: New Constructs, LLC and company filings
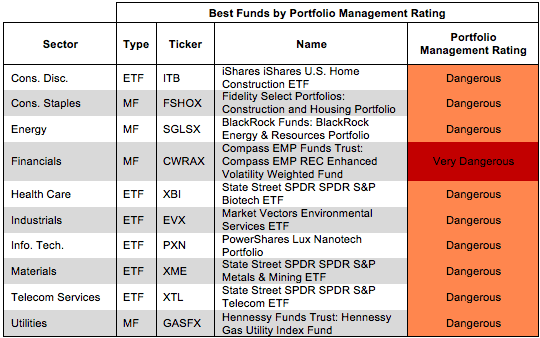
Figure 4 shows the worst ETF or mutual fund based on our Portfolio Management Rating for each sector as of January 13, 2014.
Many ETFs and mutual funds managers do a poor job identifying quality stocks. These funds are not worth owning at any cost.
Figure 4: ETF or Mutual Fund With Lowest Quality Holdings by Sector
 Source: New Constructs, LLC and company filings
Investors should care about all of the fees associated with a fund in addition to the quality of the fund’s holdings. The best ETFs and mutual funds have both low costs and quality holdings – and there are plenty of low cost funds available to investors.
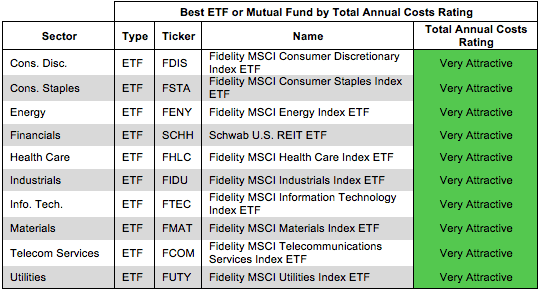
Figure 5 shows the best ETF or mutual fund in each sector according to our Total Annual Costs Rating.
Total Annual Costs incorporates all expenses, loads, fees, and transaction costs into a single value that is comparable across all ETFs and mutual funds. Passively managed ETFs and index mutual funds are generally the cheapest.
Figure 5: ETF or Mutual Fund With Lowest Costs by Sector
 Source: New Constructs, LLC and company filings
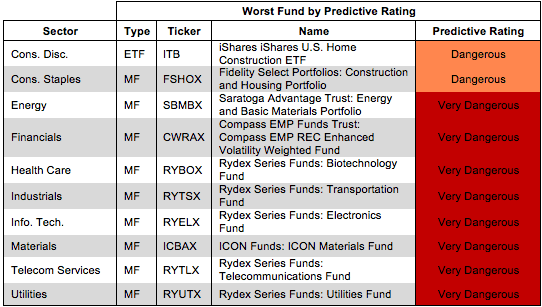
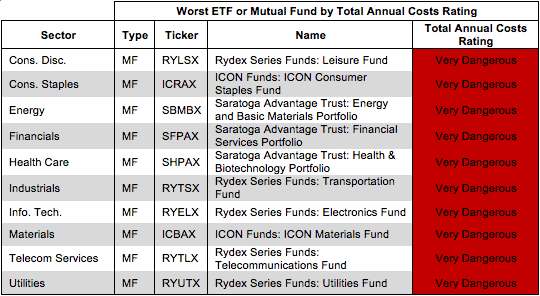
Figures 6 shows the worst fund in each sector according to ourTotal Annual Costs Rating.
The most expensive fund for each sector has a Very Dangerous Total Annual Costs Rating. Investors should avoid these funds and other funds with Very Dangerous Total Annual Costs Ratings because they charge investors too much. For every fund with a Very Dangerous Total Annual Costs Rating there is an alternative fund that offers similar exposure and holdings at a lower cost. We cover over 7000 mutual funds and over 400 ETFs and the ratings of each can be found at our free ETF & mutual fund screener. Investors have plenty of alternatives to these over priced funds.
Figure 6: ETF or Mutual Fund With Highest Costs by Sector
 Source: New Constructs, LLC and company filings
Jared Melnyk contributed to this report.
Disclosure: David Trainer and Jared Melnyk receive no compensation to write about any specific stock, sector or theme.