Finding the best ETFs is an increasingly difficult task in a world with so many to choose from.
You Cannot Trust ETF Labels
There are at least 40 different large cap value ETFs and at least 221 ETFs across all styles. Do investors need that many choices? How different can the ETFs be?
Those 40 large cap blend ETFs are very different. With anywhere from 20 to 1,410 holdings, many of these large cap ETFs have drastically different portfolios, creating drastically different investment implications.
I am sure that large cap value ETFs hold many of the same big stocks such as International Business Machines (IBM), Chevron (CVX) and 3M (MMM). However, investors need to know what else those ETFs hold before they can say they have done their due diligence.
The same is true for the ETFs in any other style, as each offers a very different mix of good and bad stocks. Some styles have lots of good stocks and offer quality funds. The opposite is true for some styles, while others lie in between these extremes with a fair mix of good and bad stocks. For example, large cap value, per my 2Q Style Rankings report, ranks fourth out of 12 styles when it comes to providing investors with quality ETFs. Large cap blend ranks first. Small cap value ranks last. Details on the Best & Worst ETFs in each style are here.
Still, the bottom line is: ETF labels do not tell you what kind of stocks you are getting in any given ETF.
Paralysis By Analysis
I firmly believe ETFs for a given style should not all be that different. I think the large number of large cap value (or any other) style of ETFs hurts investors more than it helps because too many options can be paralyzing. It is simply not possible for the majority of investors to properly assess the quality of so many ETFs. Analyzing ETFs, done with the proper diligence, is far more difficult than analyzing stocks because it means analyzing all the stocks within each ETF. As stated above, that can be as many as 1,410 stocks for one ETF.
Any investor worth his salt knows that knowing the holdings of an ETF is critical to finding the best ETF.
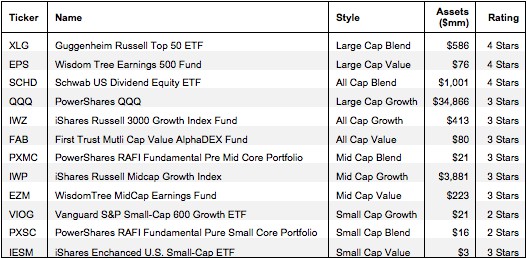
Figure 1: Best Style ETFs
 Sources: New Constructs, LLC and company filings
The Danger Within
Why do investors need to know the holdings of ETFs before they buy? They need to know to be sure they do not buy an ETF that might blow up. Buying an ETF without analyzing its holdings is like buying a stock without analyzing its business and finances. As Barron’s says, investors should know the Danger Within. No matter how cheap, if it holds bad stocks, the ETF’s performance will be bad.
PERFORMANCE OF ETF’s HOLDINGs = PERFORMANCE OF ETF
Finding the Style ETFs with the Best Holdings
Figure 1 shows my top rated ETF for each style. Importantly, my ratings on ETFs are based primarily on my stock ratings of their holdings. My firm covers over 3000 stocks and is known for the due diligence we do for each stock we cover. Accordingly, our coverage of ETFs leverages the diligence we do on each stock by rating ETFs based on the aggregated ratings of the stocks each ETF holds.
Schwab U.S. Dividend Equity ETF (SCHD) is the top-rated all cap blend ETF and the overall top-rated ETF of the 221 style ETFs I cover. Only the large cap blend, large cap value and all cap blend styles contain any Attractive (i.e. 4-star) rated ETFs while the best every other style can offer is a Neutral or 3-star ETF, or even a Dangerous or 2-star ETF.
Sometimes, you get what you pay for.
It is troubling to see one of the best style ETFs, PowerShares S&P 500 High Quality Portfolio (SPHQ) have just $240 million in assets. The largest ETF in that large cap blend style, SPDR S&P 500 (SPY), has nearly $125 billion in assets thought it only gets a Neutral (3-star) rating. SPY’s expense ratio at 0.09% is lower than SPHQ’s at 0.60%, but as I state above, no matter how cheap an ETF, if it does not hold good stocks it will not perform well. Sometimes, you get what you pay for.
Another example of how you sometimes get what you pay for: Vanguard Mid-Cap Value ETF (VOE). VOE has over $1.7 billion in assets despite getting a Dangerous (2-star) rating. Investors seem to be attracted to its low expense ratio of 0.10% with less regard for the quality of its holdings. Meanwhile, the top-rated mid cap value ETF, WisdomTree MidCap Earnings Fund (EZM), has a 3-star rating but only $223 million in assets.
I cannot help but wonder if investors would leave VOE if they knew that it has such a poor portfolio of stocks. It is cheaper than EZM, but as previously stated, low fees cannot growth wealth; only good stocks can.
Sometimes, you DON’T get what you pay for.
One of the smallest ETFs in Figure 1 is Vanguard S&P Small-Cap 600 Growth ETF (VIOG) with just $21 million in assets. Sadly, other small cap growth ETFs with more assets and similar portfolios (virtually identical top 5 holdings) charge more than VIOG. In other words, small cap growth ETF investors are paying extra fees for no reason.
Specifically, at 0.28%, both SPDR S&P 600 Small Cap Growth ETF (SLYG) with $216 million in assets and iShares S&P SmallCap 600 Growth Index Fund (IJT) with $1,951 million in assets charge more than VIOG, which charges 0.22%. Sometimes, you do not get what you pay for.
The worst ETF in Figure 1 is small cap blend’s PowerShares RAFI Fundamental Pure Small Core Portfolio (PXSC), which gets a Dangerous (2-star) rating. One would think ETF providers could do better for this style.
I recommend investors only buy ETFs with more than $100 million in assets. You can find more liquid alternatives for the other funds on my free ETF screener.
Covering All The Bases, Including Costs
My ETF rating also takes into account the total annual costs, which represents the all-in cost of being in the ETF. This analysis is simpler for ETFs than funds because they do not charge front- or back-end loads and transaction costs are incurred directly. There is only the expense ratio, which is normally quite low. However, my ratings penalize those ETFs with abnormally high expense ratios or any other hidden costs.
Top Stocks Make Up Top ETFs
One of my favorite holdings in Schwab U.S. Dividend Equity (SCHD) is Intel Corporation (INTC), which gets my Very Attractive (5-star) rating. INTC has an impressive track record of profit growth over long periods of time. Since 2001, it has grown after-tax profit (NOPAT) by 18% compounded annually and has a top quintile return on invested capital (ROIC) of 20%. Despite this track record of growth, its valuation of ~$24.08/share gives it a price to economic book value ratio of only 0.7. This valuation implies that the market expects the company’s NOPAT to permanently decline by 30%. A track record of profitability combined with a low valuation means an attractive risk/reward for investors. A 3.7% allocation to Intel helps to explain why SCHD gets my Attractive rating.
iShares S&P 100 Index Fund (OEF), is the ETF with the most assets (~4.2 billion) to get my Attractive (4-star) rating. Microsoft (MSFT) is one of my favorite stocks held by OEF and earns my Very Attractive rating. MSFT has grown NOPAT by an impressive 28% compounded annually over the past decade. Moreover, MSFT has been displaying high and growing economic earnings since 2000.
With such an impressive track record of growth, it is surprising that MSFT is trading at only ~$35.08/share. Its no-growth value (i.e. economic book value) per share is $51.05. The current market valuation is predicting a permanent 31% decline in MSFT’s profitability. High profitability combined with low market expectations is good news for holders of MSFT, which includes, indirectly, investors in OEF.
Andre Rouillard and Sam McBride contributed to this post
Disclosure: David Trainer owns MSFT. David Trainer, Sam McBride and Andre Rouillard receive no compensation to write about any specific stock, sector, or theme.