Check out this week’s Danger Zone interview with Chuck Jaffe of Money Life and MarketWatch.com.
Small-cap value ETFs and mutual funds are in the Danger Zone this week due to poor holdings and high total annual costs.
The small-cap value style ranks last out of twelve fund styles as detailed in my Style Rankings for ETFs and mutual funds report. It gets my Dangerous rating, which is based on aggregation of ratings of 13 ETFs and 269 mutual funds in the small-cap value style.
The problem here is that ETF providers and mutual fund managers are not allocating enough to the good stocks in this style. 100% of ETFs and 94% of mutual funds in the small-cap value style earn a Dangerous-or-worse rating even though 351 (over 20% of the total market value) of the 2159 stocks in small-cap value funds get an Attractive-or-better ranking. See Figure 1 for details.
Figure 1: Small-cap Value Style Landscape For ETFs, Mutual Funds & Stocks
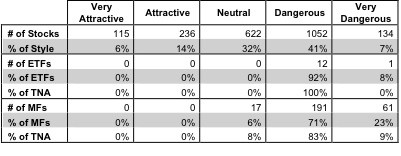 Sources: New Constructs, LLC and company filings
With so many good stocks to choose from, it is hard to understand why ETF providers and mutual fund managers do not allocate more to them.
ProShares Ultra Russell2000 Value (UVT) is my worst-rated small-cap value ETF and ProFunds: Mid-Cap Value ProFund (MLPSX) is my worst-rated small-cap value mutual fund. UVT earns my Dangerous rating and MLPSX earns my Very Dangerous rating.
UVT allocates over 53% of its capital to Dangerous-or-worse rated stocks. Its total annual costsof 1.06% are also unusually high for an ETF. There is no reason for investors to accept UVT’s high costs for allocating so much to poor holdings.
Sovran Self Storage, Inc (SSS) is one of my least favorite stocks held by UVT and earns my Very Dangerous rating. SSS has experienced a decline in after-tax cash flow (NOPAT) for two out of the past three years. It has not earned positive economic profits in any year going back to 1998 when our model begins. Despite these poor results, SSS is valued at ~$62.29/share, which implies 19% growth in NOPAT compounded annually over the next 14 years. Such high expectations seem overly optimistic for any company much less for one with a ppor track record of profit growth. SSS offers investors too much risk for too little potential reward.
MLPSX allocates over 55% of its capital to Dangerous-or-worse stocks and has total annual costsof 6.03%, the highest of all small cap value funds and among the highest of all mutual funds. To justify its total annual costs to its investors, MLPSX must outperform its ETF benchmark [iShares Russell 2000 Value Index Fund (IWN)] by 5.92% annually. That hurdle is awfully high especially for a fund that allocates so much to poor holdings.
Everest Re Group Ltd (RE) is one of my least favorite stocks held by MLPSX and earns my Dangerous rating. There is a major disconnect between this company’s accounting earnings the value it actually creates/destroyes for investors. In their 4Q12 earnings conference call on February 7, CEO Joe Taranto claimed that the company has achieved a 13% increase in shareholder value compounded over an 18 year period. While our model doesn’t go back that far, RE has earned negative economic profits—i.e. destroyed shareholder value—in two of the past four years, including the last reported fiscal year. It also has a negative economic book value, meaning the perpetuity value of RE’s cash flows for the last reported fiscal year is less than its liabilities. Many investors may not be aware that the company carries significant underfunded pension ($96 million in 2011) and stock option ($74 million) liabilities. These details can only be found in the company’s 10-K report to the SEC.
Most of the investing world ignores 10-K season, but 10-Ks contain the most important financial information, especially the Financial Footnotes. These footnotes allow one to reverse accounting distortions and get a sense of the true profitability and valuation of stocks.
RE’s NOPAT was -$150 million in the last reported fiscal year and has declined in three out of the past four years. Meanwhile, the current share price of ~$124.51 implies that NOPAT will get back into the positive and grow to over $1.8 billion (over twice its historical peak!) over the next 15 years. Owners of this stock are taking a great risk in betting on such impressive growth.
One of my favorite stocks held by small-cap value ETFs and mutual funds is Lexmark International, Inc. (LXK), which earns my Very Attractive rating. LXK is a solid, if unspectacular, performer. It has grown after tax profit (NOPAT) by 4% compounded annually for the past 13 years. A current free cash flow yield of 11% bodes well. The most attractive aspect of LXK, however, is its extremely low valuation. At its current share price of ~$22.25, LXK has a price to economic book value ratio of 0.2. This ratio means the market is expecting LXK to experience a permanent decline of 80% in NOPAT. Such low market expectations combined with strong historical performance means good risk/reward for investors.
The takeaway for small cap value investors is: you are better off creating and investing in your own basket of quality small cap stocks than you are trusting your money with ETFs or mutual fund managers in this style.
As detailed in “Cheap Funds Dupe Investors”, the fund industry offers many cheap funds but very few funds with high-quality stocks, or with what I call good portfolio management.
Sam McBride contributed to this report.
Disclosure: David Trainer and Sam McBride receive no compensation to write about any specific stock, sector, or theme.