The large-cap value style ranks fourth out of the twelve fund styles as detailed in my style roadmap. It gets my Neutral rating, which is based on an aggregation of the ratings of 38 ETFs and 744 mutual funds in the large-cap value style as of July 17, 2012. Reports on the best & worst ETFs and mutual funds in every sector and style are here.
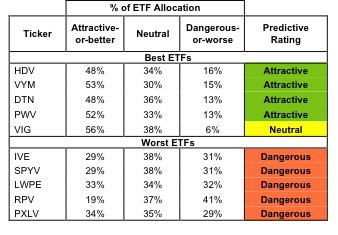
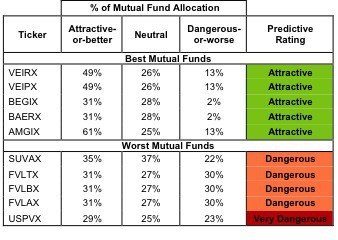
Figures 1 and 2 show the five best- and worst-rated ETFs and mutual funds in the style. Not all large-cap value style ETFs and mutual funds are created the same. The number of holdings varies widely (from 14 to 1358), which creates drastically different investment implications and ratings. The best ETFs and mutual funds allocate more value to Attractive-or-better-rated stocks than the worst, which allocate too much value to Neutral-or-worse-rated stocks.
To identify the best and avoid the worst ETFs and mutual funds within the large-cap value style, investors need a predictive rating based on (1) stocks ratings of the holdings and (2) the all-in expenses of each ETF and mutual fund. Investors need not rely on backward-looking ratings. My fund rating methodology is detailed here.
Investors seeking exposure to the large-cap value style should buy one of the Attractive-or-better rated ETFs or mutual funds from Figures 1 and 2.
See ratings and reports on all ETFs and mutual funds in this style on my free mutual fund and ETF screener.
Figure 1: ETFs with the Best & Worst Ratings – Top 5
* Best ETFs exclude ETFs with less NAV’s less than 100 million.
Sources: New Constructs, LLC and company filings
WisdomTree LargeCap Value Fund (EZY) is excluded from Figure 1 because its total net assets (TNA) are below $100 million and it does not meet our liquidity standards.
Figure 2: Mutual Funds with the Best & Worst Ratings – Top 5
* Best mutual funds exclude funds with NAV’s less than 100 million.
Sources: New Constructs, LLC and company filings
Four mutual funds are excluded from Figure 2 because their total net assets (TNA) are below $100 million and do not meet our liquidity standards.
iShares High Dividend Equity Fund (HDV) is my top-rated large-cap value ETF and Vanguard Fenway Funds: Vanguard Equity Income Fund (VEIRX) is my top-rated large-cap value mutual fund. Both earn my Attractive rating.
PowerShares RAFI Fundamental Pure Large Value Portfolio (PXLV) is my worst-rated large-cap value ETF and World Funds Trust: Union Street Partners Value Fund (USPVX) is my worst-rated large-cap value mutual fund. PXLV earns my Dangerous rating and USPVX earns my Very Dangerous rating.
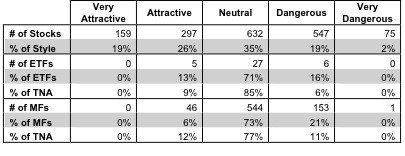
Figure 3 shows that 456 out of the 1710 stocks (over 45% of the total net assets) held by large-cap value ETFs and mutual funds get an Attractive-or-better rating. However, only 5 out of 38 large-cap value ETFs (less than 9% of total net assets) and 46 out of 744 large-cap value mutual funds (less than 12% of total net assets) get an Attractive-or-better rating.
The takeaway is: large-cap value ETFs and mutual fund managers allocate too much capital to Neutral-or-worse-rated stocks.
Figure 3: Large-cap Value Style Landscape For ETFs, Mutual Funds & Stocks
As detailed in “Cheap Funds Dupe Investors”, the fund industry offers many cheap funds but very few funds with high-quality stocks, or with what I call good portfolio management.
Investors need to tread carefully when considering large-cap value ETFs and mutual funds, because the vast majority of the ETFs and mutual funds in this style get a Neutral-or-worse rating. Only 5 ETFs and 46 mutual funds in the large-cap value style allocate enough value to Attractive-or-better-rated stocks to earn an Attractive rating.
International Business Machines (IBM) is one of my favorite stocks held by large-cap value ETFs and mutual funds and earns my Very Attractive rating. IBM was a company on the ropes following the PC revolution about twenty years ago, but more recently their expertise in IT systems and data analysis has them looking like a wily veteran that gets stronger and stronger every year. The past decade has seen steady growth in revenues and NOPAT, with impressively widening pre-tax operating margins (from 11.1% NOPBT margin in 2001 to 20.3% in 2011).
Simultaneously, IBM’s ROIC has been steadily climbing from 9.4% in 2001 to 15.4% in 2011. That’s a sign that management is an exceptional steward of shareholder capital and is focused on value-creating projects. Best of all, IBM’s stock price implies that the company’s years of profitable growth are over and that Big Blue’s profits will decline by about 10% permanently. The market’s pessimism means IBM’s current price offers attractive risk/reward.
General Electric (GE) is one of my least favorite stocks held by large-cap value ETFs and mutual funds and earns my Dangerous rating. GE is a great company to contrast with IBM. Both are old and venerable cornerstones of American industry, but unlike IBM, GE has seen its operating profits flounder atop of ballooning outlays of capital. Relative to IBM, GE’s management has been a very poor steward of shareholder capital.
Over the last decade, GE has more than doubled the amount of capital invested in its various business operations, from $127 billion in 2001 to more than $280 billion as of fiscal year 2011. Have these massive investments paid off for shareholders? Consider the fact that GE brought in $15.2 billion in NOPAT in 2001. In 2011, more than $150 billion of investments later, GE earned only $14.7 billion. Dismal returns on new investments explain why GE’s ROIC has atrophied from a healthy 12.7% in 2001 to only 5.7% in 2011. The company has not earned returns higher than its cost of capital since 2003. Growth at such low levels of profitability destroys shareholder capital.
Worse yet, GE’s current stock price ($~19.70) implies it will grow profits at 10% compounded annually for the next 20 years. That sounds like a tough task for a company that has poured out $150 billion dollars over the last decade without any profit growth to show for it. GE is undoubtedly large-cap, but value? I don’t see much value creation going on at GE. Value destruction and an expensive valuation are not a good combination.
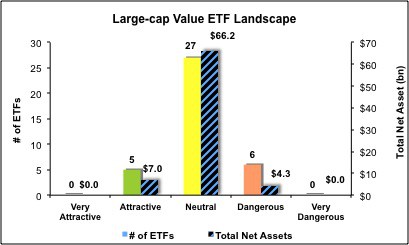
Figures 4 and 5 show the rating landscape of all large-cap value ETFs and mutual funds.
Our style roadmap report ranks all styles and highlights those that offer the best investments.
Figure 4: Separating the Best ETFs From the Worst Funds
Figure 5: Separating the Best Mutual Funds From the Worst Funds
Review my full list of ratings and rankings along with free reports on all 38 ETFs and 744 mutual funds in the large-cap value style.
Disclosure: I receive no compensation to write about any specific stock, sector, style or theme.


