

If you’ve been reading these pages for very long, you’ve likely learned that there are a lot of choices in the alternative investment space.
In July, we published a review of alternative investment funds (“Tough Choices: Alternative Funds in 2015”) that tracked the year-to-date performance of 68 seasoned “alts” over a dozen categories ranging from risk parity through commodities.
July’s appraisal provided a sort of telescopic view of the alts space. By that, I mean we zoomed in for a close-up of each individual category’s performance, on a stand-alone basis, rather than in combination with other assets that might be in an investor’s portfolio.
But that got me wondering: Could we get a different perspective on alts if we put them in harness with stock and bond exposures in a real world simulation? In other words, what kind of alternative investment would have been most useful as a portfolio diversifier over the past five years?
I used market-weighted performance in the July analysis to better reflect investor behavior. So, in keeping with that notion, I’ll use each category’s largest fund as an exposure proxy in this study. The premise here will be simple: How will a modest (15 percent) allocation to an alternative strategy impact a balanced stock-and-bond portfolio?
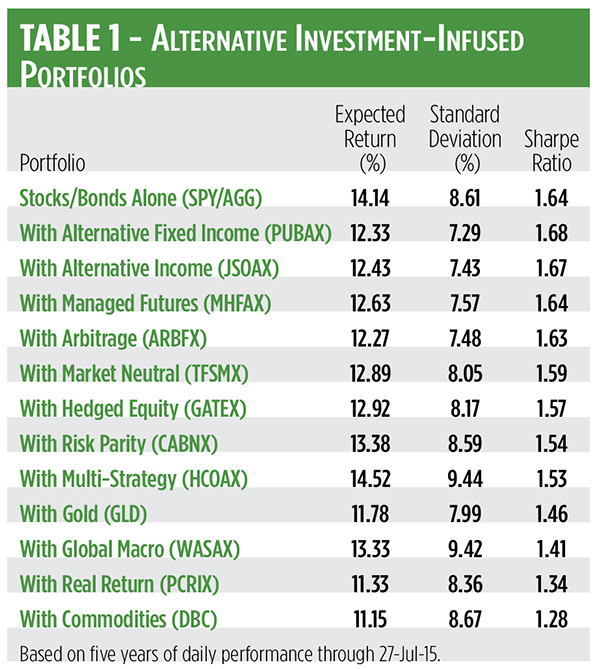
A balanced portfolio is classically defined as 60 percent stocks and 40 percent bonds. If we steal an equal amount of space from each allocation for alts, we end up with a 51 percent dollop of stocks and 34 percent for bonds. And, if we plot efficient frontiers based on the daily returns for each asset over the past five years, we end up with the prospective portfolios depicted in Table 1.
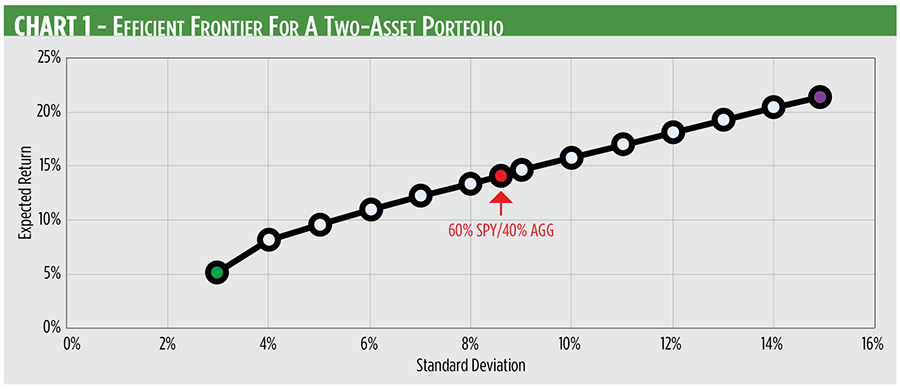
What's an Efficient Frontier?
What’s an efficient frontier? It’s a set of portfolios mixing prescribed assets in such a way as to offer the highest expected return for a given level of risk. The set, based on the assets’ realized returns, standard deviations and cross-correlations, is plotted as a line on a graph. A portfolio lying below the efficient frontier would be considered sub-optimal because it wouldn’t be expected to generate sufficient returns for the level of risk assumed.
A classically balanced portfolio of stocks and bonds, modeled with the SPDR S&P 500 ETF (NYSE Arca: SPY) and the iShares Core US Aggregate Bond ETF (NYSE Arca: AGG), would be expected to generate an annualized return of 14.1 percent at an 8.6 percent volatility, based on the assets’ performance over the past five years. You can see the 60/40 portfolio highlighted in the dead center of the efficient frontier.
An investor seeking less risk would ratchet down the SPY exposure and amp up the AGG allocation. Optimizing for the lowest standard deviation, for example, yields a portfolio comprised of 90 percent AGG and 10 percent SPY (marked in green with a 5.2 percent expected return and a 3 percent standard deviation). At the other extreme, the portfolio that produces the maximum return isn’t really a portfolio at all—it’s just a 100 percent exposure to SPY (marked in purple with a 21.3 percent expected return and a 14.9 percent standard deviation).

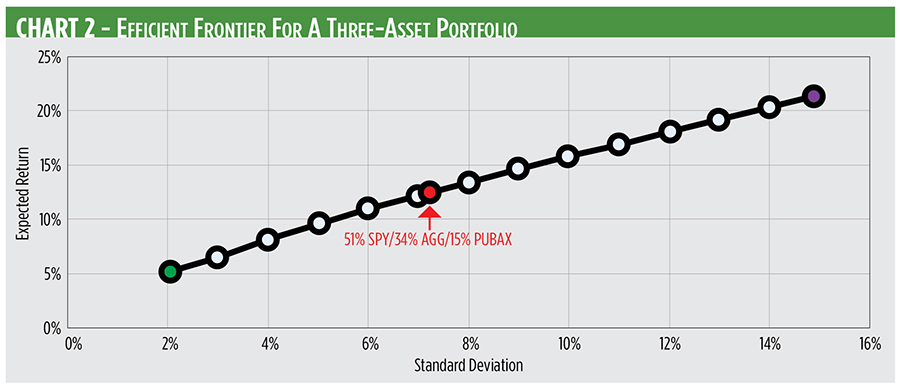
So, what kind of frontier is seen when a third asset is added? Let’s use our star diversifier from the July survey, the PIMCO Unconstrained Bond Fund (OTC: PUBAX). Over five years, PUBAX has averaged a 2.1 percent annual return with a 2.5 percent standard deviation—definitely a low-risk, low return play. As you might expect, making room for an allocation to PUBAX lowers portfolio returns. But, as an offset, it also lowers overall risk.

Chart 2 lays out the efficient frontier for a three-asset portfolio containing various levels of SPY, AGG and PUBAX. A portfolio mix including a 15 percent allocation to PUBAX sits just above the efficient frontier, suggesting the carve-out pays off, if only slightly, with a superior reward-to-risk ratio.
Portfolio efficiency can be boiled down through the Sharpe ratio, a classic measure of risk-adjusted returns. You can see that a dose of PUBAX yields a better risk-adjusted return than the traditional two-asset portfolio. And so it is, too, for a portfolio augmented with a 15 percent allocation to the JPMorgan Strategic Income Opportunities Fund (OTC: JSOAX).
Adding managed futures exposure through the A-class futures fund Equinox MutualHedge Futures Strategy A (OTC: MHFAX) seems to be a push: a 15 percent allocation doesn’t improve the risk-adjusted return of a two-asset portfolio, but it doesn’t worsen matters either.
Less Efficient Add-ons
Other alternative exposures, however, are less efficient add-ons. At the very bottom of the efficiency scale are real assets. And no wonder. Commodities have taken a beating since their 2011 peak. That’s dragged down the PIMCO Commodity Real Return Strategy Fund Institutional (OTC: PCRIX), the PowerShares DB Commodity Index Tracking Fund (NYSE Arca: DBC) and the SPDR Gold Shares Trust (NYSE Arca: GLD).
Global macro exposure through the Ivy Asset Strategy Fund (OTC: WASAX) isn’t providing a diversification benefit, either. That may, in fact, be due to the fund’s exposure to precious metals and foreign currencies which have been slammed lately by a resurgent U.S. greenback.
The oft-touted contention that diversification reduces risk seems only partially true if you look at the data in Table 1. Only two alternative investment add-ons produced better risk-adjusted gains than the two-asset portfolio, one carve-out was a wash and nine actually seem to drag down portfolio performance. So, why is that?
Two reasons, really. Perhaps the exemplars of each exposure aren’t the “best” funds. They were picked in July on the bases of size and track record length. There’s a good chance that smaller or younger funds could be better portfolio diversifiers over a five-year stretch.
More significant, though, is the outsized performance of domestic equities in the wake of the 2008 financial crisis. Stocks have been in an unrelenting bull market over the past five years, leaving other asset classes pretty much breathing their exhaust fumes. Tossing virtually any asset class into a portfolio with stocks is going to seem dilutive.
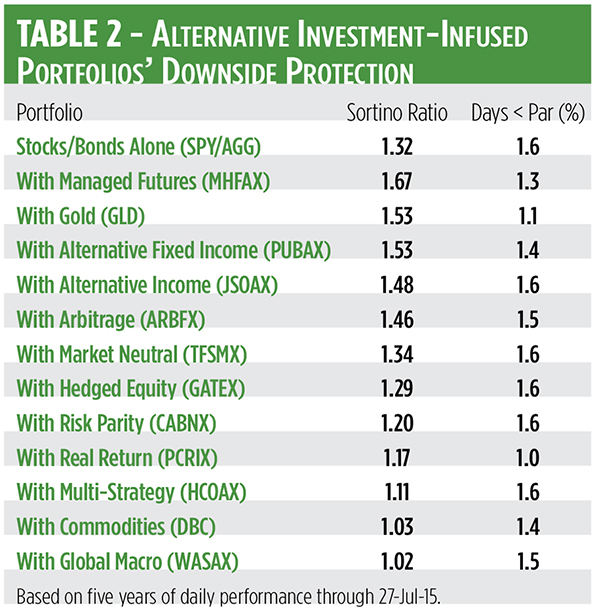
But let’s not be too hasty to dismiss alternative investments. If you consider the funds’ ability to contain downside risk, they’ve actually been fairly successful. While only two alt-enhanced portfolios outdid the two-asset portfolio’s Sharpe ratio, six yield better Sortino ratios (see Table 2). Like the Sharpe metric, the Sortino ratio measures risk-adjusted returns but uses only downside deviation, not upside volatility, in its calculation. A high Sortino ratio means the add-on helped the portfolio hold on to gains earned in bull moves.
Another measure of downside protection, the percentage of days under par, depicts the amount of time a portfolio spends under water, i.e., below its starting value. On average, portfolios with alts exposure were in the red 1.4 percent of the time, compared to 1.6 percent for the classic stock and bond mix.
Portfolio optimization with alternative investments will be a different game when stock returns normalize. The compound annual growth rate of the S&P 500, counting dividends, has been 9.6 percent since 1928, less than half the index’s growth rate in the past half-decade.
“If you rank the top 50 one-day moves in the S&P 500,” says MIT economist Andrew Lo, “a fair number of those happened within the last five or 10 years. That tells you that we're in a different, riskier market now.”
Only time will tell, but with mean reversion probable in coming years, the utility of alternative investments is likely to be more fully realized.