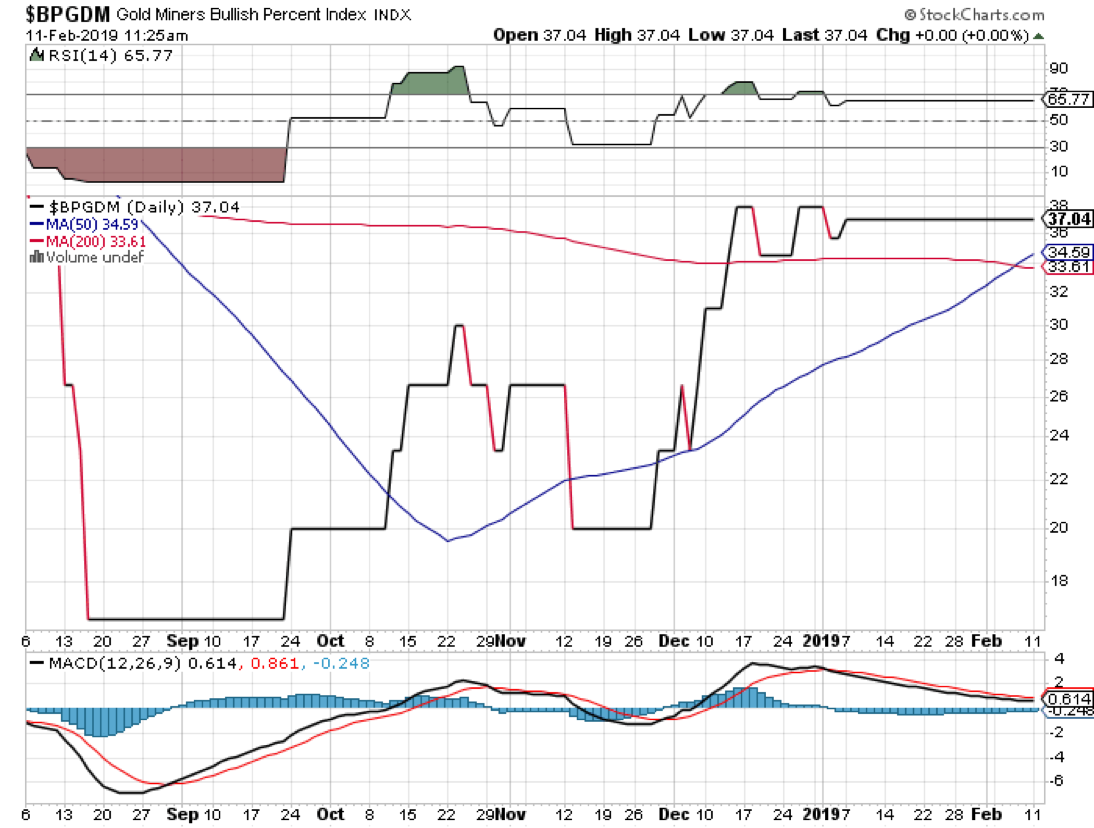
There was a quiet celebration last week among gold stock traders. On Thursday, an aptly named “golden cross” appeared on the daily chart of the Gold Miners Bullish Percent Index. You’ll be forgiven if you didn’t hear the champagne corks popping. Not everybody follows this metric.

The index tracks the proportion of gold stocks exhibiting bullish patterns in their point-and-figure charts. So, where does the cross come in? The index’s 50-day moving average (the blue line in the price chart above) crossed above its 200-day average (the red line). That’s a universally accepted sign of upside momentum.
The quietude of last week’s festivities stems in part because the actual bullish percentage is still low: It’s only 37 percent. Yet, that’s nearly double the level seen in the autumn of 2018. If you’re a gold stock watcher, you might have already noticed the rebound in some of the miners’ prices.
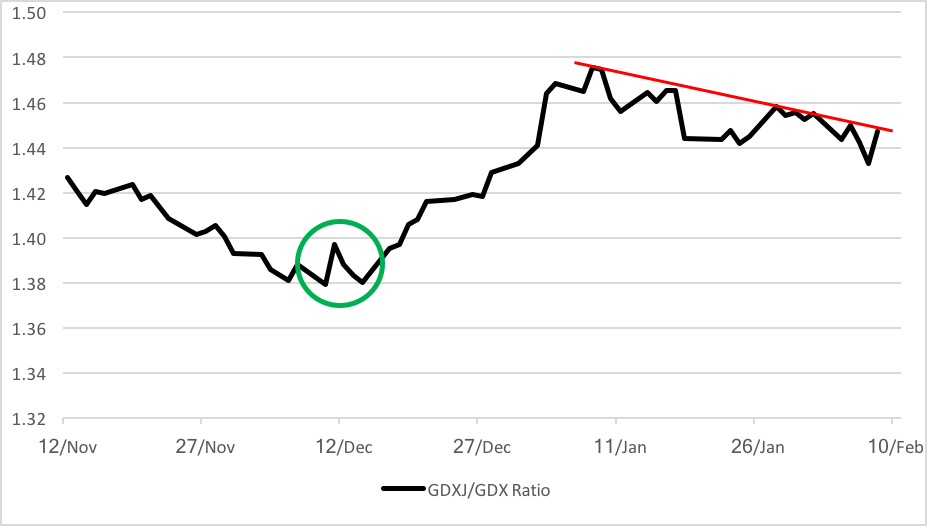
There have been other clues of bullish stirrings in the miners, to be sure. The Gold Miners Ratio, the quotient of the VanEck Vectors Junior Gold Miners ETF (NYSE Arca: GDXJ) price over that of the VanEck Gold Miners ETF (NYSE Arca: GDX), pulled up from its downtrend back in December.

GDX is a portfolio of global precious metals producers with a decided U.S. tilt. More than 70 percent of GDX’s market capitalization arises from domestically domiciled companies. GDXJ is GDX’s younger sibling and is made up, in large part, of smaller companies still in their exploratory and development stages. Many of these companies have yet to generate revenue, let alone earnings. Obviously, an investment in GDXJ is more speculative compared with GDX, so variations in the level and direction of their price ratio indicates gold punters’ risk appetite. This winter, GDXJ’s price rose at a faster pace than GDX’s, as reflected in the chart above.
But is that trend sustainable? Well, there are clear indications that there’s room on the upside for at least some gold miners. A look at the Gold Miners Ratio’s chart makes us think that the seasoned gold producers have better prospects. From here, GDXJ has the technical oomph to rise 16 percent; the target for GDX is 20 percent. It seems the ratio’s already discounting this. You can see the ratio’s been gradually easing from its early-January peak.
Two GDX constituents stand out in particular for their longer-term technical strength. Anglo gold Ashanti Ltd. (NYSE: AU) broke out to the topside in December, setting a course for the $18-$19 level that, if realized, would be a 40 percent gain from today’s value. Then there’s the less volatile Alnico Eagle Mines Ltd. (NYSE: AEM) with its comparatively modest 12 percent upside potential.
Gold stock aficionados often assert that it’s the leverage in the equities that appeals to them. Gold producers are three times more volatile than bullion. Volatility, of course, is a two-edged sword. Miners often outperform gold—on the way up as well as on the way down. Witness the current state of the market. Bullion’s nearly at breakeven from its price level a decade ago, while GDX is still down 13 percent. Gold stocks, especially the juniors, significantly outgunned bullion in the run-up to gold’s 2011 peak, then plummeted with breathtaking speed.
Investing in gold miners is not for the faint of heart. A lot of capital evaporated when gold stocks broke down. Inexperience accounted for much of the loss. People just didn’t appreciate the manifold risk built into miners. Looking forward, traders would do well to recall Warren Buffett’s words: “When you combine ignorance and leverage, you get some pretty interesting results.”
Brad Zigler is WealthManagement's alternative investments editor. Previously, he was the head of marketing, research and education for the Pacific Exchange's (now NYSE Arca) option market and the iShares complex of exchange traded funds.


