The release of March’s personal consumption expenditure deflator data reveals that the market needs a newer inflation story, or any story, to trade on.
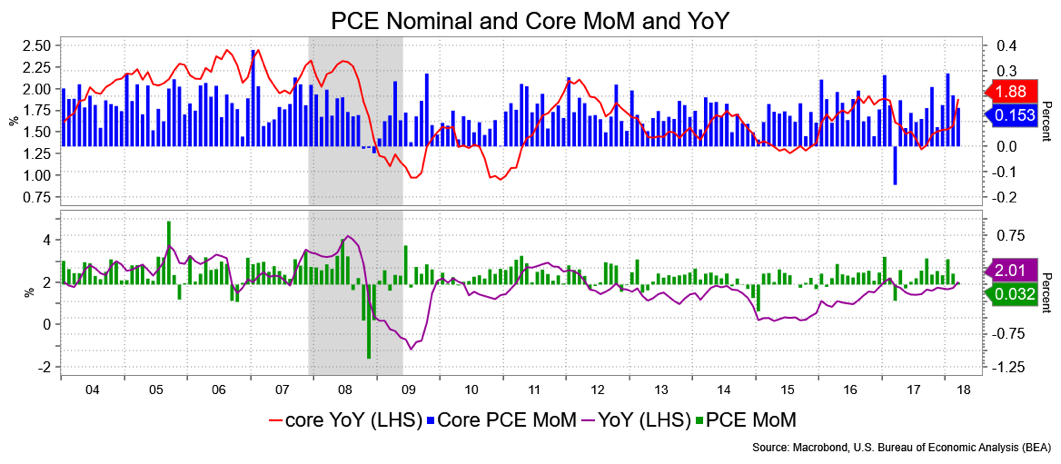
The main talking points were the year over year PCE data showing 2 percent gain and the core measures—which I always deemed the Fed’s preferred measure—hitting 1.9 percent.
The point being that the market had anticipated all that heretofore. Hitting 2 percent in one given measure is as noteworthy as 10-year notes hitting 3 percent: a point in time. Let’s not ignore the trend in inflation that has been edging higher; consumer price index is already over 2 percent, and the Fed has hiked five times and seems likely to go 2 to 3 more times this year. It would seem to me that all is working according to plan. I don’t see the latest inflation numbers as triggering the need for a more aggressive stance by the Fed or, for that matter, a renewed fear by the markets that inflation is getting out of hand. At last glance, the market had priced in slightly better than even odds for a third hike in December.
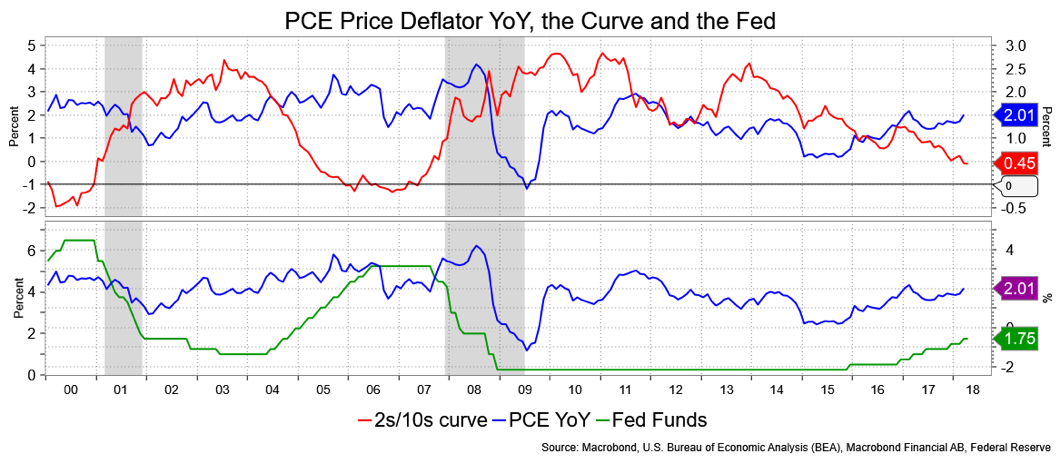
My point is that the Fed has hiked six times in this cycle and has 2.5 more to go this year (I’m allowing for 50 percent odds for a December hike). Also, we have the quantitative tightening to consider. Bear in mind that when the Fed started to hike in December 2015, YoY PCE was a mere 0.5 percent and core YoY was 1.37 percent. One would think that eight plus hikes will eventually do the job of containing gains; the curve suggests that’s the case.
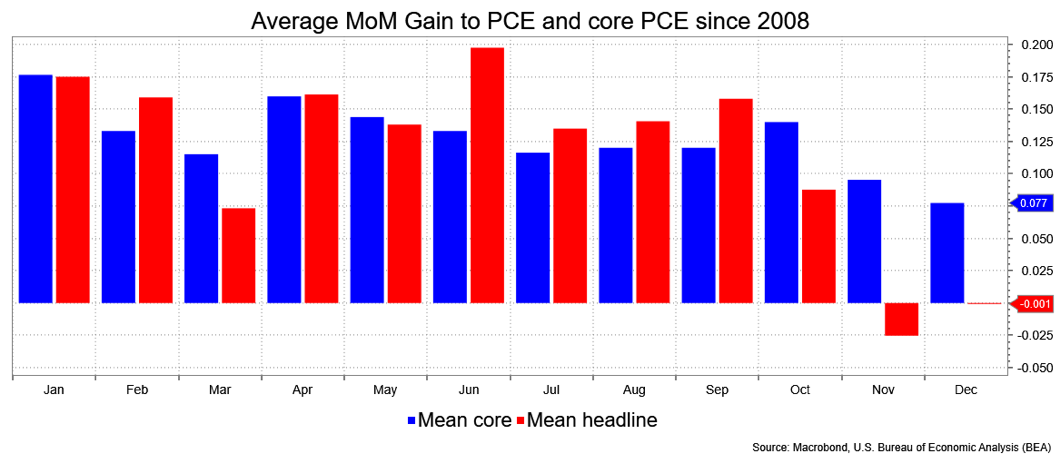
I do have some concern that the market may get antsy, at least in the coming couple of months. Some of that is due to base inflation effects whereby readings a year ago were decidedly light—core PCE YoY last August was just 1.3 percent and 1.4 percent last July for the headline to read—so a year later might see a somewhat exaggerated upward pressure. Also, March PCE tends to see softer-than-normal gains on average with stronger gains coming afterwards. I don’t want to put too much onus on that pattern, but it does dovetail somewhat with the narrative, so I’ll put it out there.
This chart attempts to show the base effects, i.e., when month over month prices a year ago were low, the YoY gain the following year jumps sharply. Even with a modest gain in the MoM figures in the current year, the low “base” 12 months prior makes for an optically sharp gain. This is why I expect the YoY figures to stabilize in the coming months.

From a strategic investment perspective, all I’ve just written gives me some encouragement that yields can edge higher in the coming weeks as I think we’ll get a chance to buy 10s at 3.25 to 3.50 percent amid a flat to flattening curve on the back of a vigilant Fed and maybe the supply considerations. If we’ve hit benchmark targets on inflation measures of 2 percent and 10s are still sticking close to 3 percent, I don’t see a big downdraft on the way. Rather, it’s a “downdrift” that I expect will happen by the middle of the summer before traditional bullish seasonals come into play (to say nothing of higher rates attracting interest and a firmer dollar).

The curve is signaling that it doesn’t see inflation as a long-term development, but rather is taking its cue from the Fed hiking when inflation is starting from such a low level. It looks like a bit of a divergence.

David Ader is Chief Macro Strategist for Informa Financial Intelligence.


