I feel remiss that I missed an anniversary celebration. Back in February, The Vanguard Group passed the one-year milestone marking the launch of its actively managed flight of factor ETFs. Perhaps you recall our early look at the Vanguard offer? The squadron is made up of a half dozen ETFs—five single-factor funds and one multifactor portfolio—benchmarked against the Russell 3000.
From a grand start, factors—at least those envisaged by Vanguard’s managers—have produced mixed results. No surprise there. After all, the funds’ objectives are quite distinct. Four of the funds fell short of the benchmark over the past 12 months, including the flagship Vanguard U.S. Multifactor ETF (BATS: VFMF). VFMF now lags the Vanguard Russell 3000 ETF (Nasdaq: VTHR) by 4.6 percent after leading the broad market fund through most of 2018.
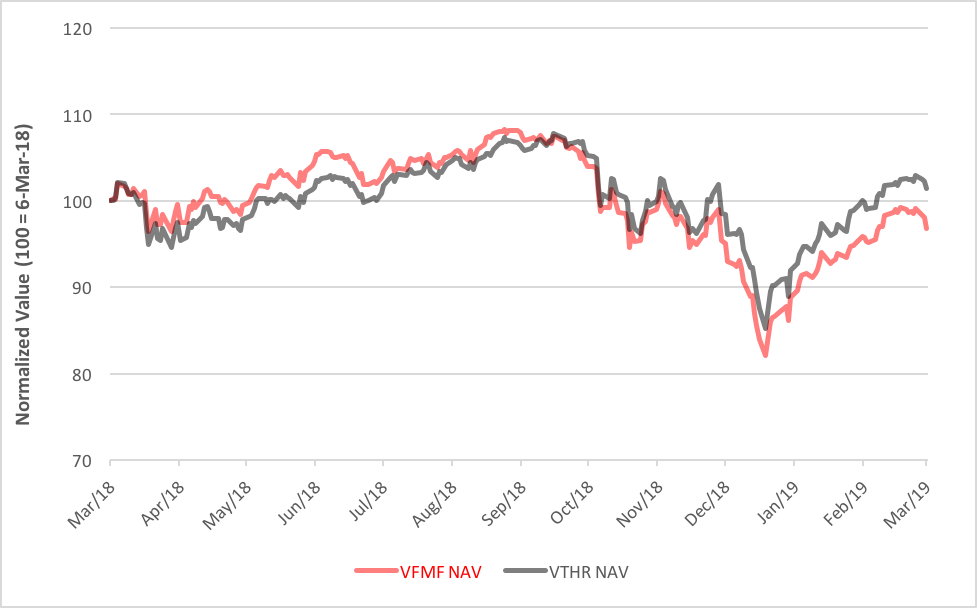
VFMF is advertised as a combo plate, offering equal dollops of momentum, quality and value exposure. So, what factors caused VFMF to slip so badly? Clues can be found by giving the single-factor strategies a quick once-over.
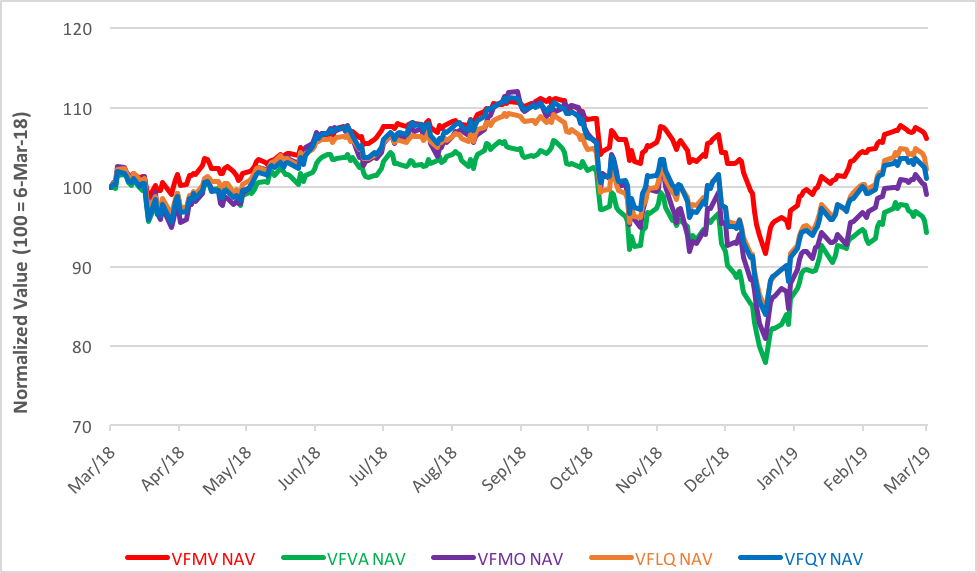
From the chart above, we can easily spot the weakest factors. The Vanguard U.S. Value Factor ETF (BATS: VFVA) slumped 5.7 percent over the past year while the Vanguard U.S. Momentum Factor ETF (BATS: VFMO) gave up nearly 1 percent. Quality, exploited by the Vanguard U.S. Quality Factor ETF (BATS: VFQY), is the only exposure in the VFMF triad that’s produced a positive return. Still, VFQY, now 1.1 percent above its year-ago level, lags the growth in the Russell 3000 ETF.
Among the single-factor funds, the Vanguard U.S. Minimum Volatility Factor ETF (BATS: VFMV) is a standout, besting VTHR by 4.6 percent. Second-best is the Vanguard U.S. Liquidity Factor ETF (BATS: VFLQ) with its 2.2 percent advance.
Plainly, Vanguard’s funds are cranking out returns at disparate rates. But you can see from the chart above that they’ve formed a rather harmonious pattern. There aren’t really any “zigs” to the market’s “zag. Take a look at their daily correlations over the past year:
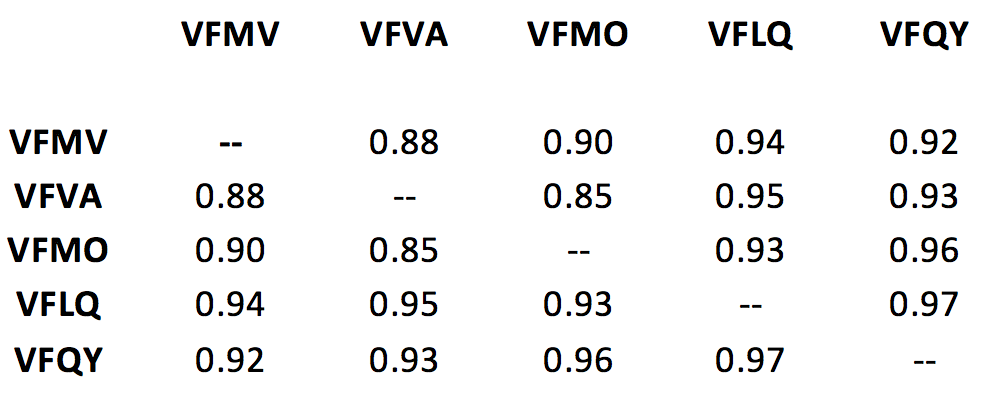
There’s not much difference, is there? What you’re getting with these funds, at least so far, are incremental tilts to the market return, not wholesale risk diversifiers. Real distinction is found in the consistency of their returns. Clearly, some strategies are better at sustaining their performance advantage than others.
Using the factor funds as substitutes for broad market exposure (VTHR) in a balanced portfolio—60 percent equity and 40 percent fixed income represented by the Vanguard Total Bond Market ETF (Nasdaq: BND)—crystallizes these distinctions in their information ratios:
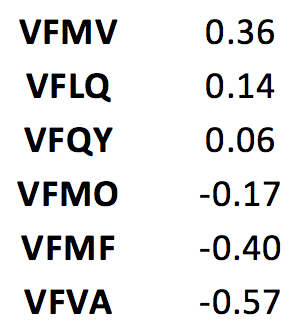
Generally speaking, information ratios between 0.40 and 0.60 represent good investments.
VFMV is the only Vanguard factor strategy that even gets close. VFMV’s direct competitor, the iShares Edge MSCI Minimum Volatility USA ETF (BATS: USMV), does better.
It’s early days still, but it seems Vanguard’s ETFs have a ways to go to set themselves apart—within and outside the family.
Brad Zigler is WealthManagement's alternative investments editor. Previously, he was the head of marketing, research and education for the Pacific Exchange's (now NYSE Arca) option market and the iShares complex of exchange traded funds.

