By Lu Wang
(Bloomberg) --The U.S. equity market in 2017 has often seemed like the world’s most expensive Jenga tower. Pull out the wrong piece, and the whole thing might crash to the ground.
But is it true? Giant technology companies like Amazon.com and Facebook are dominating indexes to a far greater degree than their size alone would dictate. That’s because along with being big, they’re rising three or four times as fast as everything else.
Friday’s market provided another glimpse of the influence as results from Amazon sent Nasdaq 100 futures down as much as 1 percent overnight.

The concentration of force has been formidable:
- The five biggest stocks in the country have rallied an average of 32 percent since December, swelling their value by $670 billion
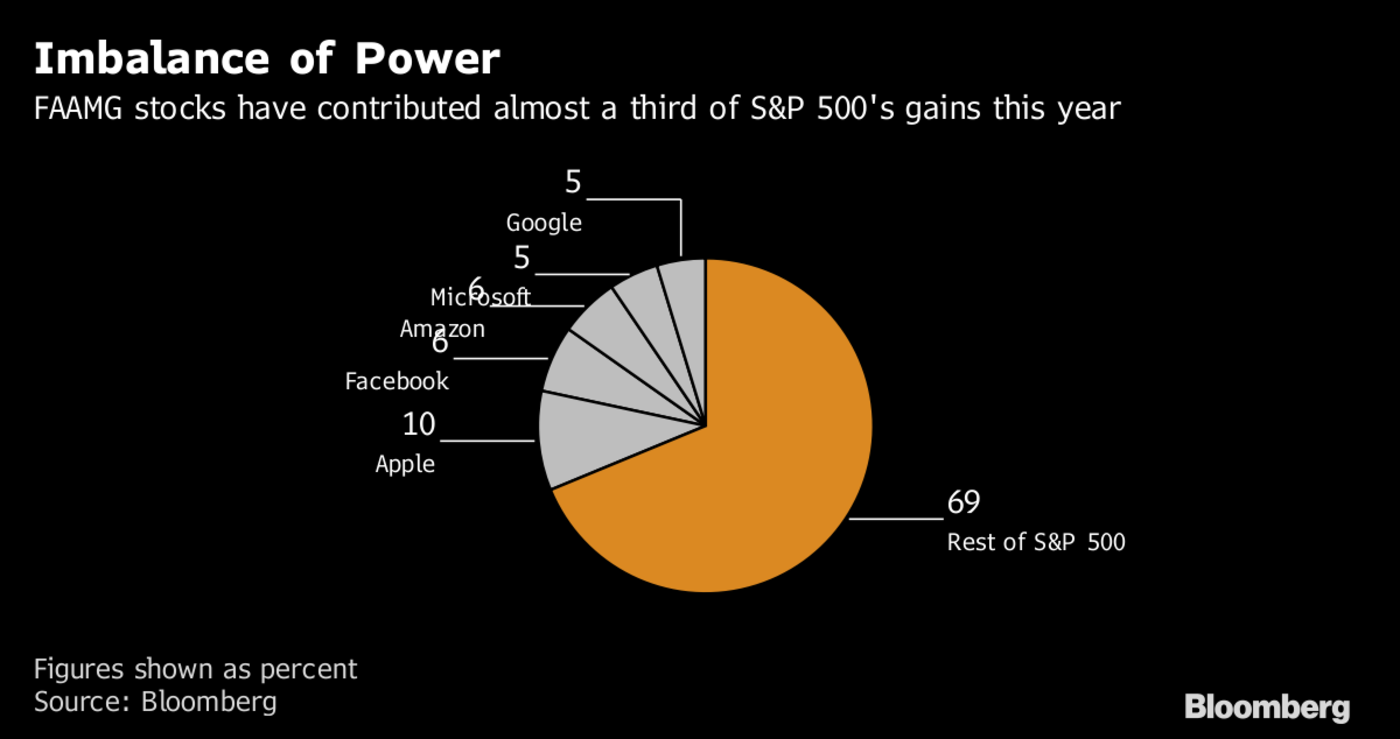
- Gains in stocks imprecisely grouped as the FANG/FAANG/FAAMG block are responsible for almost one third of the S&P 500’s advance in 2017
- Without them, the index’s 11 percent jump shrinks to 7 percent
- While tech makes up about 23 percent of the S&P 500’s market value, its contribution to the index’s gains is almost double that
Whether this is something to worry about has been a hotly contested point of portfolio analysis in the last 24 months. A broadside was fired this week by Howard Marks, the co-chairman of Oaktree Capital Group LLC, who listed addiction to FAANG-fomented gains among a handful of investor vulnerabilities that could spell doom for what is now the second-longest bull market ever.
Others are skeptical. In a celebrated rebuttal to earlier bears, Cliff Asness at AQR Capital Management showed in a series of blog posts that what’s happening this year in terms of concentrated leadership is exactly what happens every year. Four or five stocks always shoulder a disproportionate amount of upside -- nothing to get excited about.
It’s possible there’s more to the question. Loosely speaking, the FAAMG stocks are all internet and software companies -- it’s possible that creates a risk that doesn’t exist when leaders are spread out among industries. Marks focused as much on valuations as clustering gains, suggesting the hazard increases when biggest stocks trade in rarefied air. We took a look.
Market Leaders Are in the Same Industry
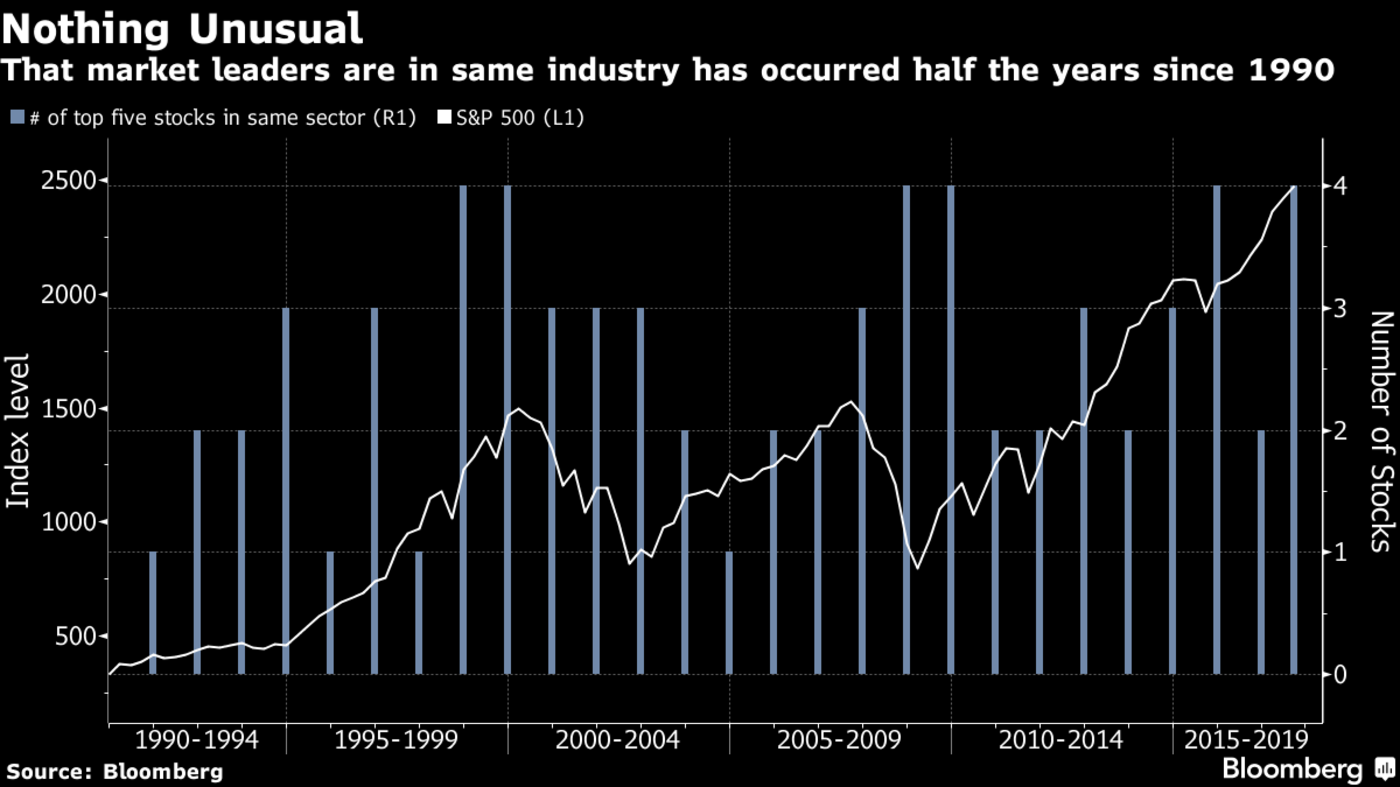
Is it bad when the market is carried aloft by stocks in the same industry? The answer is not really. While that very thing happened right before the meltdown years of 2000 and 2008, it’s happened lot of other times, too. In fact, in about half of years since 1990, the majority of the market’s five biggest-impact stocks have been in the same S&P 500 group.

Predictably, that industry was technology before the dot-com bubble burst. What was it before the financial crisis in 2008? Not banks. Tech companies accounted for three of the S&P 500’s five largest gainers in 2007, the data show.
“There isn’t anything particularly unusual about the last couple years in terms of the size of contribution the top contributors have had on the S&P 500,” Todd Hazelkorn, managing director at AQR Capital Management, said by phone. “The fact that many of the largest contributors tend to be in the same sector is in large part due to the fact that companies in the same sector tend to outperform at the same time. This is pretty common.”
Market Leaders Are All High-P/E Stocks
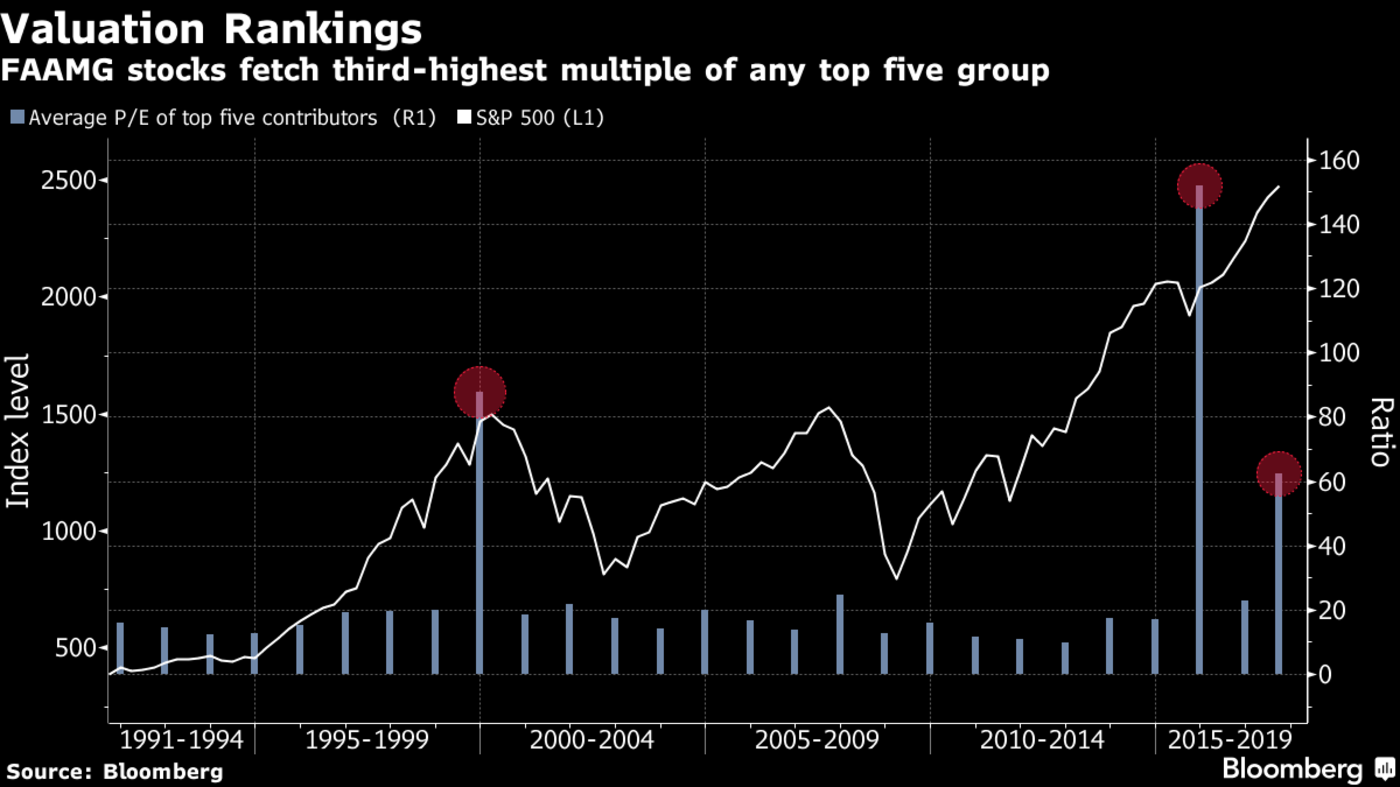
Should you sell when the stocks leading the rally are all in the upper reaches of the valuation spectrum? This idea may be more relevant to investors now, if only because the presiding FAAMG cohort is trading at the third-highest valuation of any top-five group, 62 times earnings.

Still, the evidence isn’t conclusive. The most expensive group of market leaders came in 2015, and equities have done nothing but rise since. On the other hand, elevated P/Es in 1999 foreshadowed the internet collapse.
Alas, like most simple systems for getting a jump on selloffs, data on bull market leadership is just a little too ambiguous to depend on for firm sell signals. While many investing veterans have painful memories of the ever-narrowing group of tech stocks that led the boom and bust cycles of the dot-com bubble, they fail to recall the 10 or so other years when companies in the same industry underpinned a rally -- and no rout followed.
e-Nightmares
On the basis of psychology alone, it’s the dying throes of the internet bubble that are mostly to blame for the paranoia that grips investors of a certain age when it comes to lopsided markets. In 1999, the year’s biggest contributors -- Microsoft, Cisco Systems, GE, Oracle and Nortel - surged an average of 169 percent, almost nine times the S&P 500.
But the runup to the dot-com bust also shows how futile it is to use such signals as timing tools. The five highest-impact companies all more than doubled in 1998, 15 months before the bubble popped. Their spread to the S&P 500 was bigger than the FAAMG stocks this year.
“I’m sympathetic to the general argument that at the end of the bull market, the last thing you want to own is the stuff that’s been going up on a stick for six months,” said Michael Shaoul, chief executive officer of Marketfield Asset Management. “But this is a process and it always takes much longer than what you think is possible. And I don’t think it’s reached a point that’s deeply problematic.”
To contact the reporter on this story: Lu Wang in New York at [email protected] To contact the editors responsible for this story: Jeremy Herron at [email protected] Chris Nagi


