A venerable sage once said, “The markets do whatever they have to do to frustrate the most people.” For the long-duration investor, this means that you need to look at what people are invested in to determine where the frustration will come from. Thanks to the Associated Press, we know what the masses have done with their investments in the last five years:
An Associated Press analysis of households in the 10 biggest economies shows that families continue to spend cautiously and have pulled hundreds of billions of dollars out of stocks, cut borrowing for the first time in decades and poured money into savings and bonds that offer puny interest payments, often too low to keep up with inflation.
The AP analyzed data showing what consumers did with their money in the five years before the Great Recession began in December 2007 and in the five years that followed, through the end of 2012. The focus was on the world’s 10 biggest economies — the United States, China, Japan, Germany, France, the United Kingdom, Brazil, Russia, Italy and India — which have half the world’s population and 65 percent of global gross domestic product.
Key findings:—RETREAT FROM STOCKS: A desire for safety drove people to dump stocks, even as prices rocketed from crisis lows in early 2009. Investors in the top 10 countries pulled $1.1 trillion from stock mutual funds in the five years after the crisis, or 10 percent of their holdings at the start of that period, according to Lipper Inc., which tracks funds.
They put even more money into bond mutual funds—$1.3 trillion—even as interest payments on bonds plunged to record lows.
— HOARDING CASH: Looking for safety for their money, households in the six biggest developed
economies added $3.3 trillion, or 15 percent, to their cash holdings in the five years after the crisis,
slightly more than they did in the five years before, according to the Organization for Economic
Cooperation and Development.The growth of cash is remarkable because millions more were unemployed, wages grew slowly and people diverted billions to pay down their debts.
The NACUBO study of college endowments shows that institutions acted just like individuals in the US. At the end of 2002, these institutions had 50.1% of their assets in US long-only equity. We surmise that since large-cap had outperformed smaller-cap indexes in the prior decade, that 70% of the 50.1% was in large-cap. This amounts to close to 35% of portfolios. At the end of 2012, following a decade of small/mid-cap outperformance, the same institutions had 15% US long-only equities on a dollar-weighted basis. We estimated that 40% of that ownership was in large-cap equity. Therefore, institutions reduced their long-only, US large-cap ownership from near 35% to around 6% in ten years, while in the last five, investors dumped $0.9 trillion in stocks and bought $1.3 trillion in bonds at historically microscopic interest rates.
Frustration can come in the form of broad asset class concentration like that which is mentioned by the Associated Press. Or it can drill down to a market capitalization popularity or style success among equity sectors. Before we examine the long-run ramifications of the current situation, you must consider how these situations played out in the past.
The most classic asset class concentrations of the last 50 years came at the end of 20-year positive stretches in the US stock market in 1972 and 1999. Investors had learned to be heavily committed to stocks and allowed their commitment to play out at the end to be massively concentrated in 50 large-cap growth companies. In 1972, it was the “Nifty Fifty” growth stocks and in 1999, it was the most popular technology and telecom stocks. In both cases, some securities fell over 80% in the following two years, doing irreparable damage to portfolios. Warren Buffett noted that in private pension investors placed 91% net cash flow in equity at the end of 1971 and 13% at the bottom in 1974. From the December1972 highs around 1036 on the Dow Jones Industrial Average, the market bottomed in ten years of frustration at 776 on August 12th of 1982. The outlandish concentration in all stocks tech-telecom related in 1999 ended no better. The Dow closed 1999 around 11497 and ended 2009 at 10428. In both cases a lost decade and one of torturous frustration.
By 1982, investors had adjusted to very low ownership of stocks and bonds. They sought “inflation protection” in oil, gold and short-term interest-bearing securities like CDs and money-market funds. Even though rates in long-term bonds offered 15% or more, few investors locked in those rates for the long term. After ten years of frustration, who wanted to own equities? I was a young stock broker in 1981, pitching Coca Cola shares at 9.6 P/E with a 6.7% dividend. Nobody wanted it when the money-market fund was paying 12-15%. Investors were then frustrated by an 18-year bullish run for stocks and a 31-year bull market in long-term bonds. They got committed to the wrong thing at the wrong time consistently and in the process gave themselves frustration.
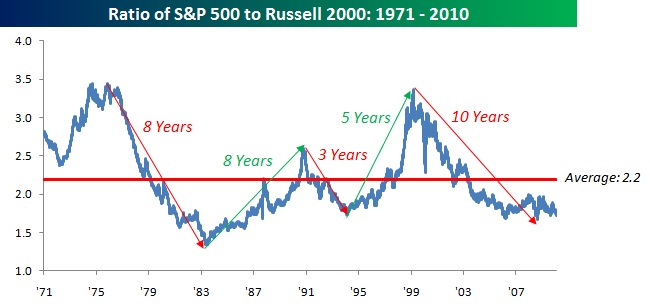
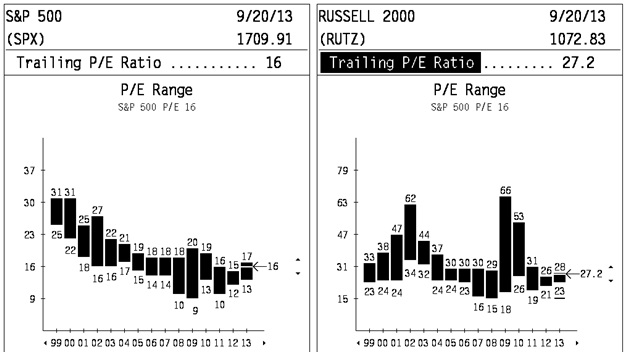
As you can see from the chart below, there can be great frustration in the performance of equities by market capitalization. When large does well for an extended period, it gathers the vast majority of the investable dollars and gets over-priced in relation to smaller-cap securities. Likewise, when small beats large extensively, it has laid the groundwork for small-cap frustration. The NACUBO study makes it look like large is attractive on a relative basis.

Source: Bespoke Investment Group

Source: ThomsonReuters Baseline
What do the AP report, the NACUBO study, and the large versus small chart tell us about future frustration? In our opinion, equities will outperform bonds and if history is the guide, bonds could frustrate for a decade. Large-cap equities should outperform small-caps, and when they do, it could last for as long as a decade. Remember, the market will do whatever is has to do to frustrate the most people.
The information contained in this missive represents SCM’s opinions, and should not be construed as personalized or individualized investment advice. Past performance is no guarantee of future results. It should not be assumed that investing in any securities mentioned above will or will not be profitable. A list of all recommendations made by Smead Capital Management within the past twelve month period is available upon request.


