How do your clients’ 401(K) plans measure up? Do they offer more or fewer investment options than other same-sized plans? Are the plan fees and the composition of those fees in line with similar plans? These aren’t just academic questions. Plans with inadequate investment options or relatively higher fees are more likely to draw participants’ ire and, possibly, legal action. From a business perspective, providing suitable investment lineups and competitive fees reflects well on your business and can generate referrals.
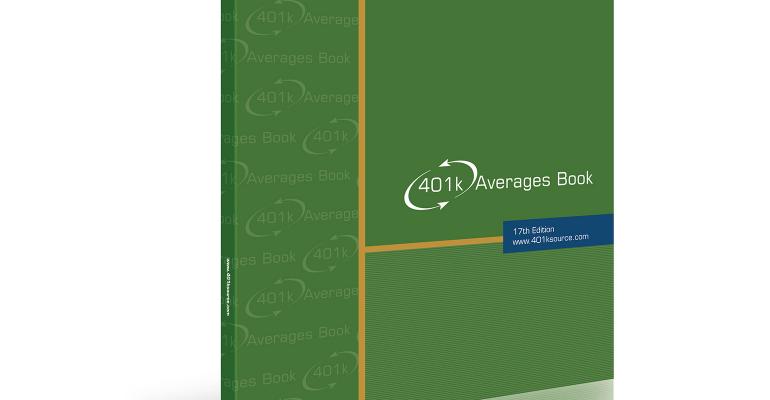
Answering these questions requires access to plan cost benchmarks, like those provided in the 401K Averages Book from Towson, Maryland-based Pension Data Source Inc. (The Book is in its 17th edition and I recently spoke with Dave Huntley, a principal with the firm, about the publication’s history, methodology, trends in plan costs and his advice for effective benchmarking.
Background
In the early 1990s there were no readily available databases to compare 401(K) plan providers. In response, Huntley and his co-principals began publishing the 401(K) Provider Directory. The information expanded beyond listing sponsors to comparing products, which resulted in the Book’s first edition in 1995. The data come from a variety of sources, Huntley says, and can include requests for information to sponsors and disclosures like 408(b)(2) documents. Instead of using plan-level data, the Book compiles results from 201 product offerings from 70 401(K) providers.
Results are presented in multiple scenarios using average per-participant account balances of $10,000 or $50,000. The number of participants range from 10 to 2,000, so the scenarios scale from plans with $100,000 balances (10 participants with $10,000 each) to $100 million of assets (2,000 participants with an average $50,000 balance each). Presenting the data this way allows readers to match their plan’s profile with a reasonable approximation instead of relying on data aggregated across a widely divergent plan sizes. Data reports include costs per participant, percentage of assets and cost breakdown by fee type and investment asset class.
Trends
As expected, the stats show that plan costs are largely a function of plan size. Average annual total per participant cost in the 10/$10,000 (10 participants, $10,000 each) group is 3.99 percent of assets. This is a bundled figure that includes investment, recordkeeping/administration and trustee fees. At the other end of the spectrum, the 2,000/$50,000 plans incur an average total bundled expense of 0.85 percent of assets.
When you drill past the averages, the stats reveal widely varying costs within each scenario. The 10/$10,000 total bundled costs range from 1.74 percent to 6.43 percent. Among the 2,000/$50,000 plans, the spread is 0.24 percent to 1.17 percent.
Huntley cites several trends that have been showing up in the cost data. The shift to passive investing is a key driver of lower costs, he notes. Additionally, record keepers’ percentage of fees has been shrinking. That’s partly in response to market competition, but it also reflects those vendors’ ability to leverage technology and pass the savings on to plan sponsors and participants. Downward pressure on advisor fees and the growing adoption of zero revenue share funds is also affecting cost breakdowns, he adds.
Effective Benchmarking
The Book provides a five-step guide for benchmarking with its data. The first step is to accurately identify a plan’s current costs, says Huntley, because investment returns are variable, but plan costs can be predicted more accurately. Consequently, accurately identifying costs provides a baseline for comparisons.
Step two is to compare plan costs with the appropriate benchmark. The Book’s categorization by number of participants, average account balance and total plan assets is sufficiently broad to facilitate at least an approximate match with the client’s plan. Once you have an acceptable match, it’s straightforward to compare your plan’s investment, recordkeeping and total bundled costs with the averages. 401ksource.com provides a free worksheet template on its site to facilitate detailed plan cost analysis.
Vendors’ services to plans nowadays are often similar, Huntley notes, but it’s still useful to identify (step 3), compare plan and participant services (step 4) and to rate those services’ quality and costs versus perceived benefit. For instance, how does the vendor provide participant education? Are the investment options limited to a single fund family or open platform? Is there a brokerage option? What sort of reports and performance guarantees does the vendor offer? The Service Summary worksheet, also available free from 401ksource.com, lists several key categories to consider.
The fifth and final step is to use the information in reaffirmation, renegotiation or to initiate a request for proposal (RFP). Consultants and plans often overlook reaffirmation, says Huntley, but it doesn’t hurt to thank the vendor for providing a cost-competitive service. If the plan’s costs are relatively high, asking current vendors to offer suggestions for cost reductions such as different share classes could lower costs through a plan amendment. If that doesn’t work out, soliciting bids from other vendors with the goal of lowering costs is the next step.


