By Dean Curnutt
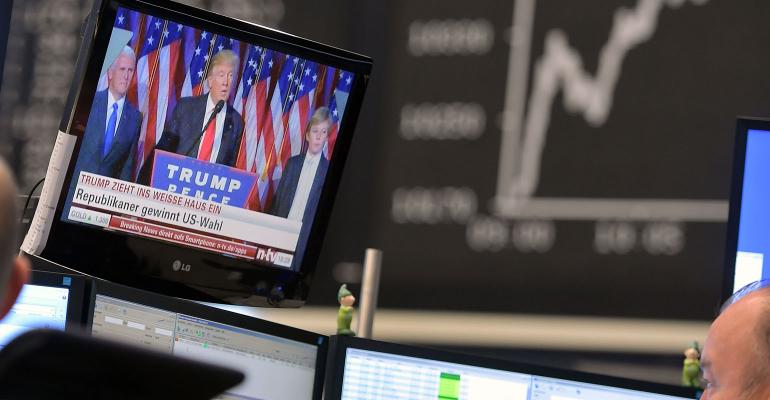
(Bloomberg Prophets) --Perhaps no consensus opinion has proven more incorrect than the notion that a Donald Trump presidency would lead to more market volatility. So range-bound has been the S&P 500 Index in 2017 that fully 60 percent of the days have produced a daily upside or downside return of less than 0.25 percentage point.
This remarkable listlessness led the VIX to close below the 10 level 18 times this year. With more than 60 percent of 2017 already in the books, the realized volatility of the S&P 500 stands at just 7.25 percent. That compares with 10 percent in 2006 during the height of the build-up in credit and leverage. Given the false signal of safety that low volatility imparted on both investors and policy makers during the pre-crisis period, there are important questions to be asked around the protracted decline in both the implied and realized volatility being experienced now.
These are not normal times, either for politics or volatility. With political dysfunction at an all-time high, why aren’t market prices more responsive to the various threats of disruption? Risk premiums around the world and across asset classes have been melting away for some time. The incredible shrinking option price has two drivers, each of which enables the other.
First, implied volatility is impacted by an overhang of the global supply of options. Generating income by writing options has proven necessary in order to counterbalance the loss of return traditionally available through sovereign bond markets. Implied volatility should be thought of as a clearing price in which there are more motivated sellers than buyers of options.
A second driver of the decline in option prices is the falling level of realized volatility. When markets fail to move with any velocity, options are worth less. And this is where the circularity results. While difficult to pinpoint, it may be that the hedging of long option positions has played a role in muting the daily fluctuations of the S&P 500.
To see this, consider a professional volatility trader who buys a call option from a stockholder who seeks income. The option trader employs a delta hedging strategy, shorting the stock to neutralize directional risk while still be able to profit from movement in the stock price. When the stock rises, the volatility trader is left with a mismatch between the option’s delta -- the change in the value of an option for each dollar change in the market price of the underlying asset -- and the shares already shorted. To regain neutrality, the trader must sell additional shares of stock. A decline in the stock price yields the opposite result: some portion of the previous short hedge position must be covered to match the option’s new delta.
If the supply of options into the market is substantial enough and if a large portion of what is purchased is being hedged, the result may be strong demand for stocks when they fall and corresponding selling pressure when they rise. While there are many contributors to the low level of market volatility -- a steady business cycle and healthy corporate profits chief among them -- the decline in daily market fluctuations has been so profound as to invite alternative explanations. Hedging may be complicit.
We must also recognize a third feature of markets that is not normal: asset price returns. In the statistical sense, “normally distributed” returns conform to the bell-curve, neatly defined by a mean and a standard deviation. In this construction, a two standard deviation event would be expected to occur 5 percent of the time. A three standard deviation event would be expected to occur just 1 percent of the time. In markets, a four standard deviation event is incredibly rare, expected to occur just once every 60 years.
Stocks returns, while approximated by the normal distribution, notoriously exhibit “fat tails,” or returns that are much larger than would be expected given the standard deviation. This is to say that if returns were truly normally distributed, the crash of 1987 is a statistical impossibility. The normal distribution also fails entirely to account for the 21 percent move in the Swiss franc as the Swiss National Bank abandoned its commitment to enforcing a ceiling on the currency in January 2015. These events notwithstanding, risk frameworks based on the assumption of normally distributed returns are commonly utilized by risk managers who derive comfort in “knowing” how probable or improbable a certain outcome is.
If it is option selling itself that is playing a role in muting market volatility and if this in turn is feeding into frameworks that influence how portfolios are sized, the degree of risk being taken in markets is likely considerable. With so much stability in asset prices, are investors under-estimating the risks? When tied back to the incredibly low level of realized volatility, the fat-tailed nature of asset price returns is a reality that investors must appreciate. Previous cycles illustrate how carry trades can reach extreme levels and volatility is lowest when the risk is the highest.
This column does not necessarily reflect the opinion of the editorial board or Bloomberg LP and its owners.
Dean Curnutt is the CEO of Macro Risk Advisors, a firm that provides global market risk analysis and execution for institutional investors. He was formerly managing director and head of equity sales-trading at Banc of America Securities.
To contact the author of this story: Dean Curnutt at [email protected] To contact the editor responsible for this story: Robert Burgess at [email protected]
For more columns from Bloomberg View, visit bloomberg.com/view


