The large-cap blend style ranks second out of the twelve fund styles as detailed in my style roadmap. It gets my Neutral rating, which is based on aggregation of ratings of 40 ETFs and 1127 mutual funds in the large-cap blend style as of July 17, 2012. Reports on the best & worst ETFs and mutual funds in every sector and style are here.
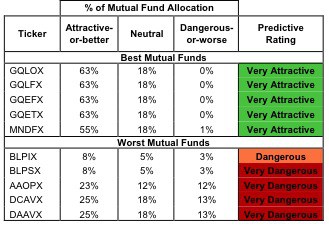
Figures 1 and 2 show the five best and worst-rated ETFs and mutual funds in the style. Not all large-cap blend style ETFs and mutual funds are created the same. The number of holdings varies widely (from 16 to 1324), which creates drastically different investment implications and ratings. The best ETFs and mutual funds allocate more value to Attractive-or-better-rated stocks than the worst, which allocate too much value to Neutral-or-worse-rated stocks.
To identify the best and avoid the worst ETFs and mutual funds within the large-cap blend style, investors need a predictive rating based on (1) stocks ratings of the holdings and (2) the all-in expenses of each ETF and mutual fund. Investors need not rely on backward-looking ratings. My fund rating methodology is detailed here.
Investors seeking exposure to the large-cap blend style should buy one of the Attractive-or-better rated ETFs or mutual funds from Figures 1 and 2.
See ratings and reports on all ETFs and mutual funds in this style on my free mutual fund and ETF screener.
Figure 1: ETFs with the Best & Worst Ratings – Top 5
* Best ETFs exclude ETFs with less NAV’s less than 100 million.
Sources: New Constructs, LLC and company filings
Figure 2: Mutual Funds with the Best & Worst Ratings – Top 5
Sources: New Constructs, LLC and company filings
PowerShares S&P 500 High Quality Portfolio (SPHQ) is my top-rated large-cap blend ETF and earns my Attractice rating. GMO Trust: GMO Quality Fund (GQLOX) is my top-rated large-cap blend mutual fund and earns my Very Attractive rating.
PowerShares S&P 500 High Beta Portfolio (SPHB) is my worst-rated large-cap blend ETF and earns my Dangerous rating. Dunham Funds: Dunham Loss Averse Equity Income Fund (DAAVX) is my worst-rated large-cap blend mutual fund and earns my Very Dangerous rating.
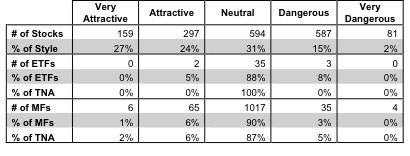
Figure 3 shows that 456 out of the 1718 stocks (over 51% of the total net assets) held by large-cap blend ETFs and mutual funds get an Attractive-or-better rating. However, only two out of 40 large-cap blend ETFs (less than 1% of total net assets) and 71 out of 1127 large-cap blend mutual funds (less than 8% of total net assets) get an Attractive-or-better rating.
The takeaway is: mutual fund managers allocate too much capital to low-quality stocks and large-cap blend ETFs hold poor quality stocks.
Figure 3: Large-cap Blend Style Landscape For ETFs, Mutual Funds & Stocks
As detailed in “Cheap Funds Dupe Investors”, the fund industry offers many cheap funds but very few funds with high-quality stocks, or with what I call good portfolio management.
Investors need to tread carefully when considering large-cap blend ETFs and mutual funds, as 96% of ETFs and 93% of mutual funds in the large-cap blend style are not worth buying. Only two ETFs and 71 mutual funds in the large-cap blend style allocate enough value to Attractive-or-better-rated stocks to earn an Attractive-or-better rating.
Wal-Mart Stores, Inc. (WMT) is one of my favorite stocks held by large-cap blend ETFs and mutual funds and earns my Attractive rating. In today’s trying economic times, shoppers are trying to stretch their dollars further, and retailers like WMT are positioned to take full advantage. Over the past 10 years WMT has consistently had an economic earnings margin over 5%, something less than 5% of companies have achieved. Meanwhile, WMT’s current stock price implies that cash flows will permanently decline by 10%, something that seems unlikely given WMT’s historical performance.
Funds that overweight stocks like WMT have a good chance of earning an Attractive-or-better rating.
Bank of America Corp (BAC) is one of my least favorite stocks held by large-cap blend ETFs and mutual funds and earns my Very Dangerous rating. Investors who are not doing the due diligence required to uncover BAC’s true economic earnings are being led astray by unreliable accounting accounting results. My March 5th, 2012 article provides more details on why I recommend Investors avoid BAC.
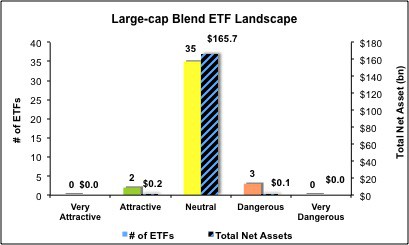
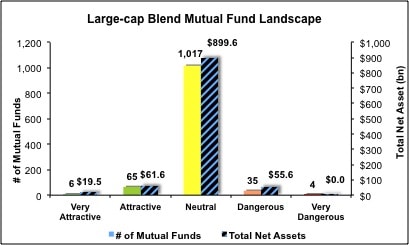
Figures 4 and 5 show the rating landscape of all large-cap blend ETFs and mutual funds.
Our style roadmap report ranks all styles and highlights those that offer the best investments.
Figure 4: Separating the Best ETFs From the Worst Funds
Figure 5: Separating the Best Mutual Funds From the Worst Funds
Review my full list of ratings and rankings along with free reports on all 40 ETFs and 1127 mutual funds in the large-cap blend style.
Disclosure: I own WMT. I receive no compensation to write about any specific stock, sector, style or theme.


