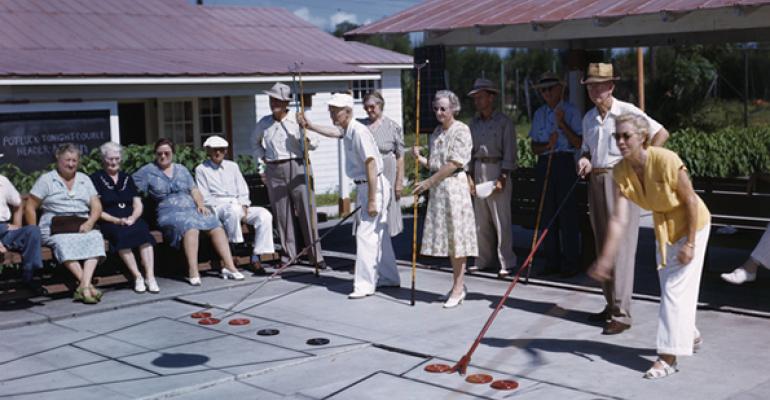
How did 2013 stack up for retirement compared to, say, 1980? Timing is everything. The following statistics compare key factors facing recent retirees versus their counterparts 33 years earlier. (Statistics that refer to trends in U.S. dollar figures are not adjusted for inflation.)
Projected number of years that $1 million will last in retirement in 2013 assuming a 4 percent annual withdrawal rate: 25
In 1980: 30+
Projected annual real return on investment over 30 years on a portfolio of 60 percent equities, 40 percent bonds in 2013: 1.9 percent
In 1980: 6.9 percent

Projected average annual inflation rate over 30 years in 2013: 2.5 percent
In 1980: 3.5 percent
Percent of working households at risk of being unable to maintain standard of living in retirement in 2013: 52
In 1980: 30
Personal savings rate in 2013: 4.8 percent
In 1980: 9.7 percent
Percent of healthcare costs paid out of pocket in 2013: 16.4
In 1980: 9
Average out-of-pocket recurring medical expenses for retirees, not including hospital stays or nursing home care, in 2013: $1,855
In 1980: $742

Average Retirement Age
Average retirement age for men in 2013: 61
In 1980: 62
Percent of people who expect to retire after age 65 in 2013: 39
In 1980: 12
Percent of workers who retired in 2013 and expect to work in their retirement: 47
In 1980: 22

Average retirement period (life expectancy post-retirement, in years) for men in 2013: 19.3
In 1980: 14.9
Average life expectancy of women who make it to age 65 in 2013: 88.8
In 1980: 74.1

Percent of individuals claiming Social Security benefits at age 62 in 2013: 42
In 1980: 60
Percent of Americans living in multigenerational households in 2013: 18
In 1980: 12
Percent of young adults (25-34) living in multigenerational households in 2013: 22.7
In 1980: 11
Rank of Wyoming among the “Best States to Retire”: 1
Rank of Arkansas on the same list: 50
Rank of Alaska among the “Most Tax-Friendly States for Retirees”: 1


