The outlook for the U.S. economy remains strong, with no signs of a major slowdown going into 2025. A long list of tailwinds is keeping the U.S. economy rolling.
- Fiscal policy continues to add stimulus through the CHIPS Act, the Inflation Reduction Act, and defense spending—dominating the negative effects of Fed hikes.
- Public and private financing markets are wide open.
- The Federal Reserve’s extended period of zero-rate policy allowed corporations and consumers to lock in low interest rates at long maturities, limiting the impact of the Fed’s rate increases.
- We continue to experience strong spending on artificial intelligence, energy transition (including electrification of the grid), and data centers. For example, the power need for the largest hyperscale data centers is currently 1 GW, and estimates show that 18 GW of additional power capacity will be needed to service U.S. data centers by 2030—the total power demand for New York City is currently around 6 GW, so there is a need to add three NYCs to the US power grid by 2030.
- The Federal Reserve’s signaling to the market that their next moves will be rate cuts (just two more quarter points forecasted for 2025) makes it more difficult to cut rates—the signal to the market about rate cuts leads to a loosening of financial conditions, pushing stock prices higher and tightens credit spreads, which in turn puts more upward pressure on growth and inflation.
- Re- or onshoring of supply chains leads to manufacturing infrastructure.
Regarding AI, Tania Babina, Anastassia Fedyk, Alex He, and James Hodson, authors of the study “Artificial Intelligence, Firm Growth, and Product Innovation,” published in the January 2024 issue of the Journal of Financial Economics,” found that AI technologies have benefited firms through product innovations—a tailwind for economic growth. However, they did not find that AI technologies did not lead to reductions in operating expenses or improvements in productivity. With that said, they noted: “Our results speak to the early wave of AI adoption, and efficiency gains, if present, may be more backloaded.” If productivity gains actually follow, inflation will be put under some downward pressure.
The election of President Donald Trump likely will provide some additional tailwinds with his focus on deregulation which leads to more spending and more innovation. For example, deregulating the housing market could increase the supply of housing (there is a national shortage of an estimated 4.5 million units.)
These tailwinds increase the risk that while the Federal Funds rate is above the “neutral rate,” interest rates will remain higher for longer, but it raises the possibility that the Fed will have to reverse course.
Labor Market Stabilizing
Nonfarm payrolls increased by 227,000 in November. Smoothing out volatility, payrolls growth over the past three months averaged 173,000, while still strong, it is a step down from the robust pace seen earlier this year, providing more room for the Fed to lower rates. The unemployment rate, which edged higher to 4.2%, pointed to cooling demand for workers, with long-term joblessness at the highest in almost three years.
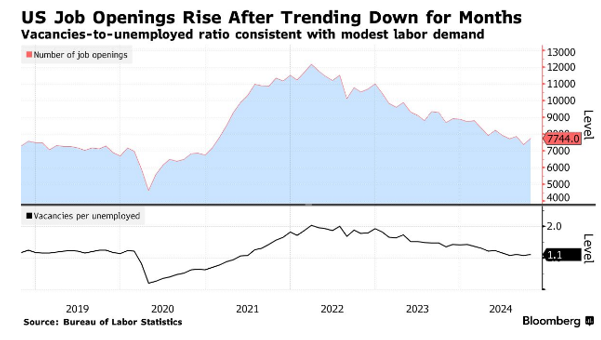
After trending down for more than two years, US job openings picked up in October while layoffs eased, suggesting demand for workers is stabilizing. According to the Bureau of Labor Statistics Job Openings and Labor Turnover Survey, known as JOLTS, available positions increased to 7.74 million from a revised 7.37 million reading in September. The levels of layoffs also decreased to the lowest since June, while the quits rate picked up to the highest since May—workers are more confident in their ability to find a new job. In addition, the number of vacancies per unemployed has stabilized at 1.1.
And, finally, in November, average hourly earnings rose 4% from a year earlier, providing support for consumer spending.
Potential Headwinds
- A significant increase in tariffs could increase inflation pressures and has the potential to lead to a retaliatory trade war, with negative consequences for global economic growth.
- Concerns about the growing debt burden and the risk of rising inflation could lead to both rising longer-term interest rates and cause the Fed to reverse course and tighten monetary policy.
- The Treasury still needs to reduce the size of the balance sheet it acquired. Shrinking the balance sheet effectively tightens monetary policy, with potential negative impact on both interest rates and economic growth.
Deficit Burden Increasing
The large budget deficits incurred over the past 25 years led to the net interest bill now exceeding the Defense Department’s spending on military programs for the first time. It now accounts for about 18% of federal revenues, almost double the ratio from just two years ago—with costs set to rise as the Fed refinances the existing $35 trillion in debt at today’s higher rate and the deficit continues to increase. The weighted average interest on outstanding US debt was 3.32% at the end of September
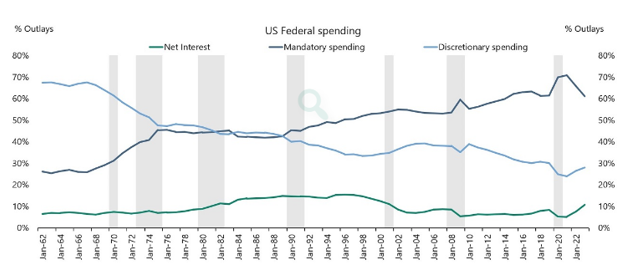
There are two categories of spending in the federal budget process: discretionary and mandatory.
Discretionary spending is subject to the appropriations process, and mandatory spending includes entitlement programs, such as Social Security and Medicare.
The share of government spending on mandatory spending has increased from 30% to 60%, thereby giving politicians less room to achieve a balanced budget without cutting entitlements.
Philly Fed’s 4th Quarter 2023 Survey of Professional Forecasters: The Wisdom of Crowds
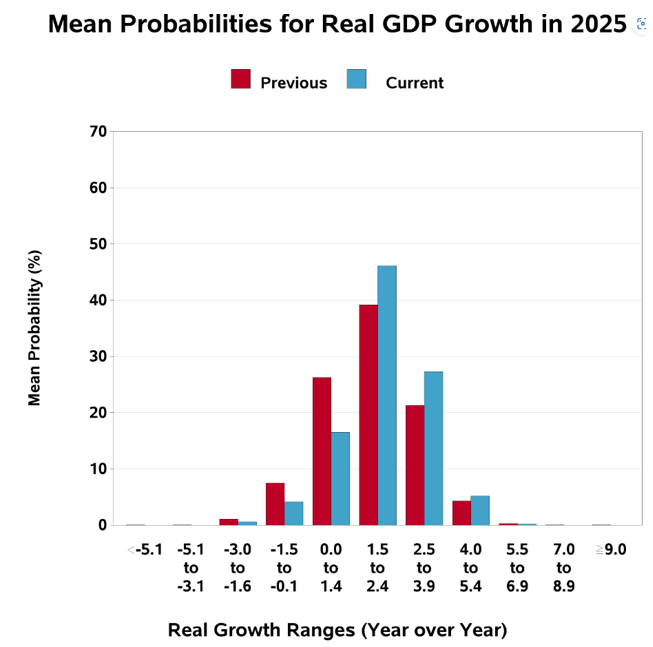
The Federal Reserve Bank of Philadelphia released its Fourth Quarter Survey of Professional Forecasters on November 15, 2024, projecting that real GDP will grow 2.2% in 2025 (up 0.3 percentage points from the estimate in the previous survey). The forecast does not include a single quarter of negative economic growth, let alone a recession, just a soft landing. The odds of a negative quarter of growth are detailed below.
Q1: 15.0%
Q2: 19.7%
Q3: 22.4%
Q4: 23.3%
The above chart shows the mean probabilities of real GDP growth in 2025. It emphasizes the importance of thinking about forecasts not in terms of point estimates but as probabilities of a wide dispersion of possible outcomes (there are no clear crystal balls).
The forecast for unemployment is that it will rise slightly from its current rate of 4.2% to 4.3% by year-end of 2025. Thus, there is no expectation of a hard landing. However, if unemployment doesn’t rise, the Fed will have more freedom to keep interest rates higher for longer, especially if inflation remains above its 2% target.
The forecast is for headline and core inflation to increase 2.4% in 2025 and remain above the 2% target. The forecast for the core CPE (the Fed’s favored measure) is 2.2%. If the core CPI drops to that level, it would allow the Fed to lower rates significantly, which would support both stocks and bond markets.
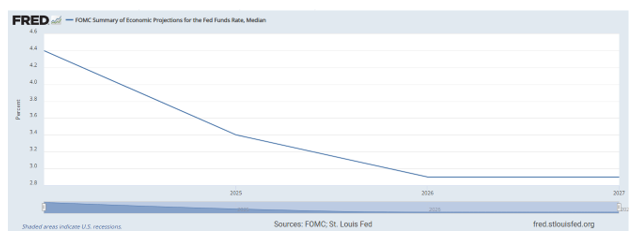
The Federal Reserve of St. Louis provides the FOMC Summary of Economic Projections for the Fed Funds Rate, Median. The latest data is from September 18, 2024.
US Economic Summary
For the past two years, we have had a bifurcated economy, with a strong service sector and a weak manufacturing sector. Another unusual bifurcation is that while financial conditions are easy (equity valuations are high and credit spreads are low), borrowing conditions remain tight, especially for consumers. A third bifurcation is that while lower-income and indebted individuals have been negatively impacted by rising interest rates, higher net-worth individuals and savers have benefited from rising equity prices and rising rates on their savings.
The slowing of inflation toward the 2% rate targeted by many central banks should allow for the easing of monetary policy around the globe, providing support for equity markets and other risk assets. The “Goldilocks economy” with the Fed likely achieving its goal of a soft landing, coupled with the beginning of a rate-cutting cycle, has investors optimistic, which eases financial conditions. On the other hand, the economy is not sending any signals that the Federal Reserve needs to be in a hurry to lower rates. Combining that with sluggish progress on inflation, while the path of lowering interest rates to “neutral” may not have changed, the speed of those moves likely has decelerated. In other words, rates are likely to remain higher for longer. And, for now, at least, the prospects of pro-growth policies and deregulation overshadow the risks of tariffs and rising deficits.
Finally, it is too early to assess the impact of potential new policies following Donald Trump’s election as US president. With that said, if he does implement his key policy objectives—lower taxes, higher tariffs, and reduced immigration—that could leading to higher equity prices, higher inflation, higher interest rates, and a stronger dollar.
Equity Markets Outlook
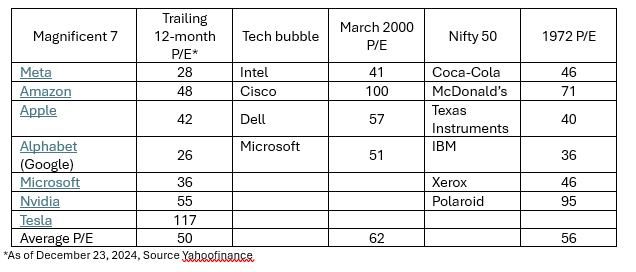
Just as we have had a tale of two economies (strong services but weak manufacturing), we have had a tale of two markets, with a bifurcation of valuations between the performance of the Magnificent 7 and the rest of the market. That has resulted in a wide dispersion in valuations, similar to what we experienced in the late 1990s. Fortunately, the rest of the market has valuations that are much closer to their historical averages.
While investors have reasons to be optimistic as most central banks around the globe are now lowering interest rates as inflation approaches their targets and rates are well above neutral, since the market is forward-looking, valuations already reflect information. As of December 23, 2024, Yahoo Finance showed that Vanguard's U.S. Total Stock Market ETF (VTI) had a trailing 12-month price-to-earnings (P/E) ratio of 26.4 (about its average over the last 40 years). Excluding the Magnificent 7 would lower that figure significantly. In contrast, Vanguard’s Total International ETF (VXUS) had a P/E of 14.6, well below its historical average (for example, from 1996-2023, the MSCI EAFE Index had an average P/E of about 21). Similarly, its Emerging Markets Stock Index ETF (VWO) had a P/E of just 13.9.
Value stocks are trading as if we are already in a serious recession. For example, Avantis' U.S. Small-Cap Value ETF (AVUV) was trading at just 12.0 times earnings; its International Small-Cap Value ETF (AVDV) was also trading at a multiple of 9.3; and its Emerging Markets Value ETF (AVES) was trading at a multiple of just 9.1. On the other hand, the large growth stocks are trading at historically very high valuations. For example, the Vanguard Growth ETF (VUG) was trading at a P/E of 39.3.
Don’t let recency bias keep you from investing in asset classes that have performed relatively poorly, such as international stocks (relative to U.S. stocks) and U.S. small and value stocks (relative to U.S. large and growth stocks). Their valuations are now trading at historically large discounts, increasing the odds that they will outperform going forward.
With that said, it is just as important to remember that, as the historical record shows, expensive stocks can always get pricier. Consider that Fed chairman Alan Greenspan called the market irrationally exuberant in December 1996. From 1997-1999, the S&P 500 returned 27.6% per annum, providing a total return of 107.6%. That provides a good example of why investors should not try to time markets based on valuations.
Here's one other bit of historical data to keep in mind. 2023-2024 will be only the fifth time since 1926 that the S&P 500 returned more than 25% in back-to-back years. In the four prior cases (1927-28, 1935-36, 1954-55, and 1997-98), the average return in the following year was -4%.
The Explosive Growth of Private Credit: Is There a Bubble?
The growth of the private credit market exploded after the global financial crisis of 2008-2009 as private credit rushed to fill the gap that the banking industry was no longer able to fill because of the distress of its balance sheets. Tightened capital standards made loans to middle-market companies unattractive for banks, shutting out most small- and middle-size companies from the bank market. In addition, the 2010 enactment of the Dodd-Frank Act made it increasingly expensive for small banks to operate, cutting off their supply of loans to small and mid-size companies.
Another reason for the explosive growth is that corporations have found benefits in private lending that are sufficient to offset their higher yields. Those benefits include:
- Speed of execution.
- No mandated public disclosure of proprietary information.
- Less ongoing disclosure is required for fundraising in the public market.
- Avoiding the time-consuming and expensive process of obtaining a rating from one or more of the rating agencies.
- The ability to customize the loan structure to meet the particular needs of the borrowing company offers management greater flexibility.
- A borrower facing financial difficulties will find it is easier in a private debt transaction for management to do a workout with only one or a few lenders compared to a large number of lenders in a public bond offering.
The growth rate of private credit has been so rapid (growing to nearly $2 trillion by the end of 2023, roughly ten times larger than it was in 2009) that it has raised concerns that there is a bubble. If that were the case, credit spreads would have come way down, and lending standards (covenants and loan-to-values) would have loosened. Looking at the Cliffwater Corporate Lending Fund (CCLFX), with about $23 billion in assets under management, we don’t see any signs of either. As of the end of the third quarter, the average loan-to-value was just 41%, and the fund was providing a net yield of about 11.5%, about 6.5% above the one-month Treasury bill rate. Such figures don’t show any indication of a bubble.
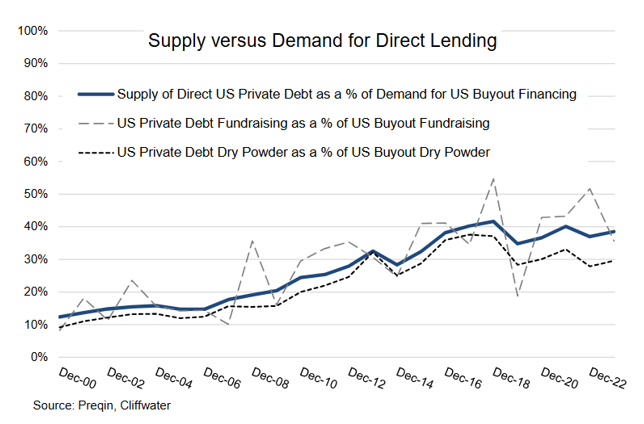
As further evidence of the lack of signs of a bubble, the following chart provides three related metrics that put the growth of performing private debt in the context of a broader US private market ecosystem that has been growing at three times the rate of the public markets over the last 20 years. The three metrics are fundraising, dry powder, and total supply/demand.
All three metrics express private debt as a percent of U.S. buyouts, the segment of private equity that most utilizes private debt for financing. Since approximately 50% of U.S. buyouts are debt-financed, U.S. private debt would equal approximately 100% of U.S. buyout equity capital if it was the only source of financing. However, as the solid line in the chart shows U.S. private debt, represented by the Preqin database consisting primarily of institutional private debt capital, represents approximately 40% of the financing needs of U.S. buyout firms. If there were too much new institutional supply, which includes public and private BDCs, market penetration would increase, pushing out other suppliers of buyout financing like banks, insurance companies, non-bank finance companies, and hedge funds.
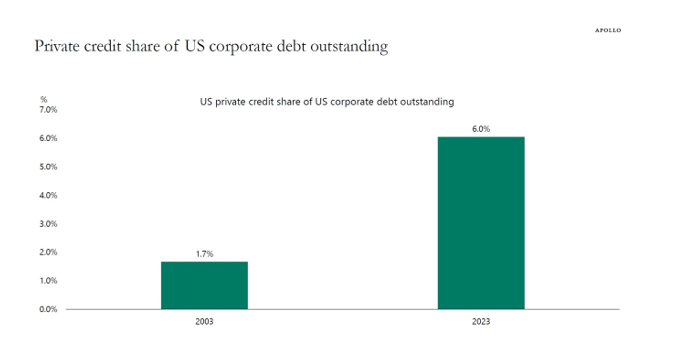
It’s also important to note that despite the rapid growth, looking at the sum of bank lending to corporates plus the total value of corporate credit markets plus the total value of private credit shows that private credit only makes up 6% of total lending to corporates (chart below). Thus, there is still plenty of room for growth in the sector. In its “Future of Alternatives 2029,” Pequin (leading provider of data and insights for the alternative investments industry) forecasts private debt to grow further by an average of 12.0% from end-2023 to 2029F.
The bottom line is that private credit will continue to grow as companies get access to a broader spectrum of financing.
Cautionary warning
My 50 plus years of experience has taught me that one of the biggest and most common mistakes investors make is that they focus on forecasting the future (which is not only unknowable, but also likely filled with future unpredictable large drawdowns), instead of focusing on managing risks. That is why my reviews of the market and economy focus on risks, not specific forecasts. This tendency is a major failure for two reasons. First, investors are, on average,e highly risk averse and because stock returns are not even close to being normally distributed, large losses occur with much greater frequency than if the distribution of returns was normally distributed. The conclusion investors should draw is that their focus should be on minimizing the risks of large losses, making their portfolios more resilient to “black swan” events—or as Nassim Nicholas Taleb recommends, building portfolios that are “antifragile.” In order to do that, you need to include a significant allocation to assets whose risks are not highly correlated with the economic and geopolitical risks of equities.
Larry Swedroe is the author or co-author of 18 books on investing, including his latest, Enrich Your Future: The Keys to Successful Investing


