
In 1977, the richest 0.1% of families owned about 7% of total household wealth. By 2016, their share had almost tripled to about 20%. The increase has attracted attention among policymakers and researchers alike. Da Ke, author of the study “Left Behind: Partisan Identity, Stock Market Participation, and Wealth Inequality,” published in the July 2024 issue of the Journal of Banking and Finance, investigated whether and how opposing partisans differ in their wealth accumulation.
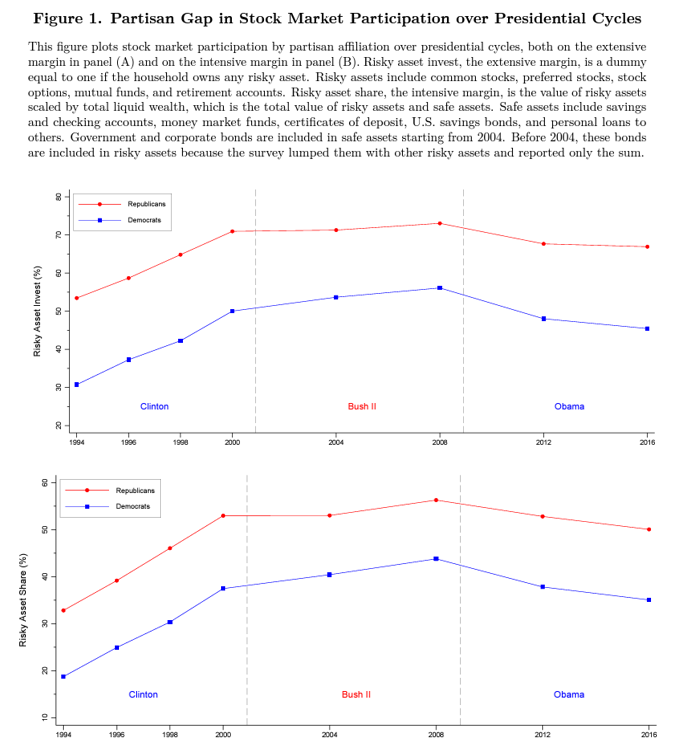
Ke drew on a confidential geocode version of the National Longitudinal Survey of Youth 1979 Cohort and analyzed the stock market participation decisions made by a sample of U.S. Democrats and Republicans over presidential cycles. The survey included 12,686 U.S. individuals aged between 14 and 22. Interviews were conducted in the first six months of each survey year and in more recent waves, interviews were fielded throughout the survey year and sometimes in early the following year. Ke’s sample period started in 1994 when the NLSY79 began to collect information about retirement accounts that had been lumped with safe assets in previous years, and it stopped in 2016, the last year for which the financial asset information is available. The key feature of the NLSY79 is that respondents reported their party affiliations. Ke’s sample included 3,774 Democrats and 1,990 Republicans. Here is a summary of his key findings:
Forty-five percent of the Democrats in the sample participated in the stock market, compared to almost two-thirds of the Republicans. Risky asset share followed the same pattern, with Democrats, on average, holding about one-third of their liquid wealth in stocks, compared to 48% for Republicans. Forty-two percent of the Democrats and 61% of the Republicans in the sample participated in the stock market through retirement accounts.
Single individuals accounted for more of the sample of Democrats, and white men accounted for more of the sample of Republicans.
Democrats were more likely than Republicans to be of lower socioeconomic status. On average, Democrats earned $33,000 less in family income than Republicans and possessed $167,000 less in household wealth, indicating substantial income and wealth inequality between Democrats and Republicans. While less than half of the Democrats attended college, 59% of the Republicans did.
Controlling for education, income, wealth and other relevant demographic characteristics, Democrats were 11% less likely than Republicans to participate in the stock market. This partisan gap widened sharply, by 13%, under Democratic presidencies, precisely when the stock market returns have been substantially higher. The widening of the partisan gap in stock market participation under Democratic presidencies was primarily driven by Democrats rather than Republicans. This dynamic pattern accounted for more than half of the discrepancy in wealth accumulation between Democrats and Republicans over presidential cycles.
While the partisan gap in stock market participation through directly held investment accounts narrowed during Democratic presidencies, the narrowing gap was dominated by the widening partisan gap in stock market participation through retirement accounts during the same periods.
The participation rates of both Democrats and Republicans appear to move in the same general direction within each presidency, but the rates of change vary.
Ke’s findings led him to conclude: “The presidential-cycle dynamics of the partisan gap in stock market participation bear important implications for household wealth accumulation. This is because the stock market returns in the U.S. are substantially higher under Democratic than Republican presidencies.”
The 2017 NBER paper “Political Cycles and Stock Returns,” by Lubos Pastor and Pietro Veronesi, found that from 1927 to 2015, the average excess market return under Democratic presidents was 10.7% per year, whereas under Republican presidents it was -0.2% per year. “The difference, almost 11% per year, is highly significant both economically and statistically.” Their explanation for the difference was: “When risk aversion is high, voters are more likely to elect a Democratic president; when risk aversion is low, they elect a Republican. Therefore, risk aversion is higher under Democrats, resulting in a higher equity risk premium, and thus a higher average return. In our story, the high-risk premium is not caused by the Democratic presidency; instead, both the risk premium and the Democratic presidency are caused by high risk aversion.”
Since the market has outperformed under Democratic presidents, the widening of the participation gap during Democratic regimes (driven by Democrats) has contributed to the increase in inequality. Ke concluded: “A back-of-envelope calculation suggests that the presidential-cycle dynamics of the partisan gap in stock market participation account for more than half of the discrepancy in wealth accumulation between Democrats and Republicans over presidential cycles.”
In a test of the robustness of his findings, Ke conducted similar analyses on a sample of Labour and Conservative supporters aged between 20 and 70 in the U.K. over the period of 1991−2009. Echoing his U.S. findings, Ke found: “Labour supporters are substantially less likely than Conservative supporters to participate in the stock market, controlling for their demographic characteristics.” These findings are also consistent with those of Markku Kaustia and Sami Torstila, authors of the 2010 study “Stock Market Aversion? Political Preferences and Stock Market Participation,” who found that in Finland: “A moderate left voter is 17-20% less likely to own stocks than a moderate right voter.”
Investor Takeaways
While partisanship is not the only source of wealth inequality, the findings we reviewed demonstrate that there is a substantial partisan gap in stock market participation in both the U.S. and the U.K. Ke estimated that this gap accounts for more than half of the discrepancy in wealth accumulation between opposing partisans over political cycles. A takeaway, therefore, should be to not allow partisanship to impact investment decisions.
Larry Swedroe is the author or co-author of 18 books on investing, including his latest, Enrich Your Future: The Keys to Successful Investing


