Sponsored by ProShares
The fourth quarter of 2018 was undeniably terrible for U.S. equity markets. Under pressure from politics, earnings and interest rates, markets pulled back, obliterating their year-to-date gains. But a group of companies with a simple yet distinctive mark of quality—the longest track records of consistent dividend growth—fared far better than their peers.
The S&P 500 Dividend Aristocrats—Quality that Can Endure
To better understand the kind of companies we are talking about, let’s look at one of several widely known dividend growth indexes. The S&P 500® Dividend Aristocrats® Index focuses exclusively on a select group of large-cap companies within the S&P 500—those that have grown their dividends consistently, every year, for at least 25 consecutive years.
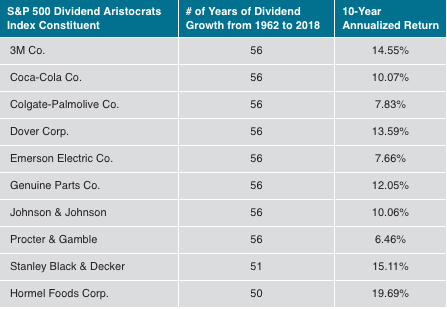
The constituents of the S&P 500 Dividend Aristocrats display characteristics that are typical of quality companies, such as stable records of profit and growth. Many, as you might expect, are household names—Coca-Cola, Johnson & Johnson, Sherwin-Williams, McDonald’s—and they have prospered year after year, raising their dividends through decades of economic cycles, political pressures and changes in consumer trends. While 25 years of dividend growth is the minimum point of entry, about half of the 57 companies in the index have grown their dividends for more than 40 years and nearly a fifth have seen half a century of dividend growth.
Companies with 50+ Years Dividend Growth
As of December 31, 2018

Source: S&P Dow Jones Indices, Bloomberg. These returns do not represent index performance.
Resilience During the Q4 2018 Downturn—Quality Drove Results Across Classes
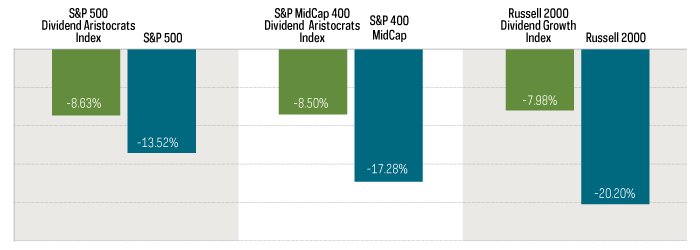
Dividend growth strategies, like the Dividend Aristocrats, showed their worth during the recent U.S. equity market turbulence in the fourth quarter of 2018. While the S&P 500® declined more than 13% during the three-month period from October 1, 2018 through December 31, 2018, the S&P 500 Dividend Aristocrats Index lost significantly less, just 8.63%.
And that wasn’t limited to the large-cap asset class. It also applied to dividend growth strategies in U.S. mid caps, measured by the S&P MidCap 400 Index versus the S&P MidCap 400 Dividend Aristocrats, and small caps, comparing the Russell 2000 Index versus the Russell 2000 Dividend Growth Index.
Outperformance of Dividend Growers Across Asset Classes
October 1, 2018 – December 31, 2018

Source: Bloomberg. Index performance returns do not reflect any management fees, transaction costs or expenses. Indexes are unmanaged, and one
cannot invest in an index.
Outperformance Potential Over Time: The Long-Term Importance of Quality
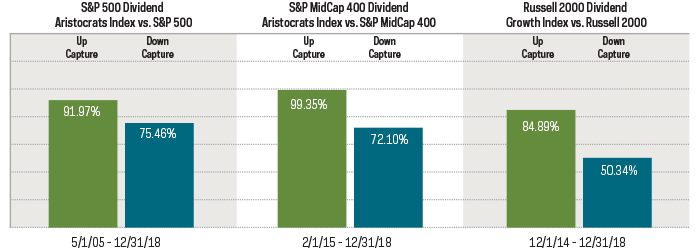
Just as importantly, if we look at the indexes since inception, the S&P 500 Dividend Aristocrats Index has captured most—nearly 92%—of the market’s gains over time, while experiencing just 75% of the losses. The up/down capture ratio, as this relationship is known, is strong for mid-cap and small-cap U.S. equities too.
Strong Up/Down Capture Ratios
Index inception – December 31, 2018

Source: Morningstar. “Up capture ratio” measures the performance of a fund or index relative to a benchmark when that benchmark has risen. Likewise, “down capture ratio” measures performance during periods when the benchmark has declined. Ratios are calculated by dividing monthly returns for the fund’s index by the monthly returns of the primary index during the stated time period and multiplying that factor by 100.
How Can This Benefit Investors?
The more uncertain the markets, the more investors may want to consider incorporating a dividend growth strategy into their portfolios. Why? Historically, companies that have grown their dividends have outperformed, with lower volatility, over time. Dividend growth exchange traded funds (ETFs) present an opportunity for investors interested in adding high-quality companies to their portfolios with the transparency, cost-effectiveness and tax efficiency of an ETF. ProShares offers the only ETF tracking the S&P 500 Dividend Aristocrats Index, as well as ETFs covering a variety of domestic and international market caps.
Visit ProShares.com to download a copy of this report, see current fund performance, and learn more about dividend growth ETFs.
Any forward-looking statements herein are based on expectations of ProShare Advisors, LLC at this time. Whether or not actual results and developments will conform to ProShare Advisors, LLC's expectations and predictions, however, is subject to a number of risks and uncertainties, including general economic, market and business conditions, changes in laws or regulations or other actions made by governmental authorities or regulatory bodies, and other world economic and political developments. ProShare Advisors, LLC undertakes no duty to update or revise any forward-looking statements, whether as a result of new information, future events or otherwise.
This information is not meant to be investment advice. There is no guarantee dividends will be paid. Companies may reduce or eliminate dividend at any time, and those that do will be dropped from the indexes at reconstitution. ETF shares are bought and sold at market price (not NAV) and are not individually redeemed from the fund. Market price returns are based upon the midpoint of the bid/ask spread at 4:00 p.m. ET (when NAV is normally determined for most funds) and do not represent the returns you would receive if you traded shares at other times. Brokerage commissions will reduce returns. Current performance may be lower or higher than the performance quoted. For standardized returns and performance data current to the most recent month end, see Performance.
Investing involves risk, including the possible loss of principal. These ProShares ETFs are diversified and entail certain risks, including imperfect benchmark correlation and market price variance, that may decrease performance. Investments in smaller companies typically exhibit higher volatility. Smaller company stocks also may trade at greater spreads or lower trading volumes, and may be less liquid than stocks of larger companies. International investments may involve risks from: geographic concentration, differences in valuation and valuation times, unfavorable fluctuations in currency, differences in generally accepted accounting principles, and from economic or political instability. In emerging markets, many risks are heightened, and lower trading volumes may occur. Please see summary and full prospectuses for a more complete description of risks. There is no guarantee any ProShares ETF will achieve its investment objective.
Carefully consider the investment objectives, risks, charges and expenses of ProShares before investing. This and other information can be found in their summary and full prospectuses. Read them carefully before investing. Obtain them from your financial advisor or broker-dealer representative or visit ProShares.com.
The "S&P 500® Dividend Aristocrats® Index" and "S&P MidCap 400® Dividend Aristocrats Index" are products of S&P Dow Jones Indices LLC and its affiliates. "Russell 2000® Dividend Growth Index" and "Russell®" are trademarks of Russell Investment Group. All have been licensed for use by ProShares. "S&P®" is a registered trademark of Standard & Poor's Financial Services LLC ("S&P") and "Dow Jones®" is a registered trademark of Dow Jones Trademark Holdings LLC ("Dow Jones") and have been licensed for use by S&P Dow Jones Indices LLC and its affiliates. ProShares have not been passed on by these entities and their affiliates as to their legality or suitability. ProShares based on these indexes are not sponsored, endorsed, sold or promoted by these entities and their affiliates, and they make no representation regarding the advisability of investing in ProShares. THESE ENTITIES AND THEIR AFFILIATES MAKE NO WARRANTIES AND BEAR NO LIABILITY WITH RESPECT TO PROSHARES.
ProShares are distributed by SEI Investments Distribution Co., which is not affiliated with the funds' advisor.


