It seems to me these days the flattening yield curve is our only constant.
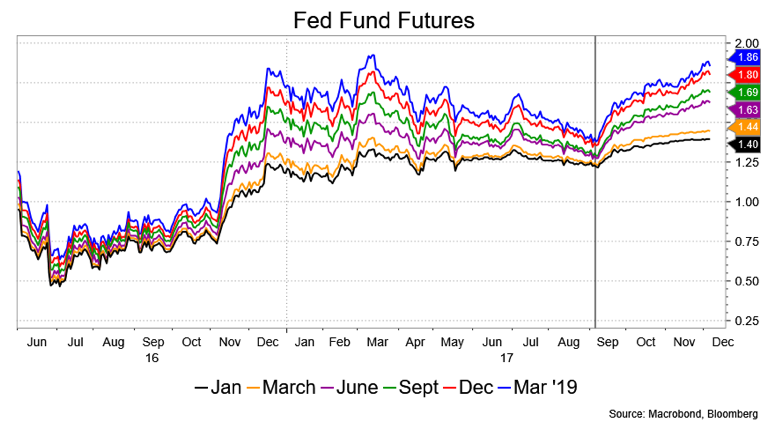
Perhaps I’m tired and certainly uninspired, but then a glance at a 10-year yield chart would tell you I have company. This could reflect how little new, critical information is in the market; we have more Fed hikes being priced in, against still subdued inflation, and we can debate what the tax plan will actual do to boost GDP.
The flattening is taking place even as we enter into years of a growing federal deficit that will boost all Treasury issuance. Despite their goal to keep the average maturity of outstanding debt at its current level, 66 months for publicly held debt, Treasury’s going to have a hard time doing so, given that such debt as a percentage of GDP is going to skyrocket. It stands at 74.9 percent today and the Congressional Budget Office projects it will rise to 91.2 percent in 10 years—and that doesn’t account for any increase as a result of the GOP tax “reform” plan.
It’s possible that the market really believes Treasury and that increasing debt will be concentrated in the front end of the curve. In the event, there’s that justification for the recent action. We also have a Fed that is clearly bent on further hikes and the market is doing an abundant job of pricing in more. And, if the GOP plan goes through and does boost GDP, given the level of equities and unemployment (the Phillips Curve apparently lives!), the Fed is likely to err on the side of more hikes, even if inflation remains subdued.

In a recent SF Fed Economic Research Paper, “What’s Down with Inflation?” the authors dive into spending categories that show “procyclical” core inflation has been considerably stronger than “acyclical” inflation. Procyclical inflation is pretty much where it was from 2002 to 2007, while acyclical is some 60 basis points less than during that era. Very specifically, they point to healthcare costs which have been held down by legislated changes in Medicare payments. The upshot is that the procyclical measures are back to pre-recession levels and, along with asset prices and tax-cut stimulus, serve as ample cover for the Fed’s move to normalization.
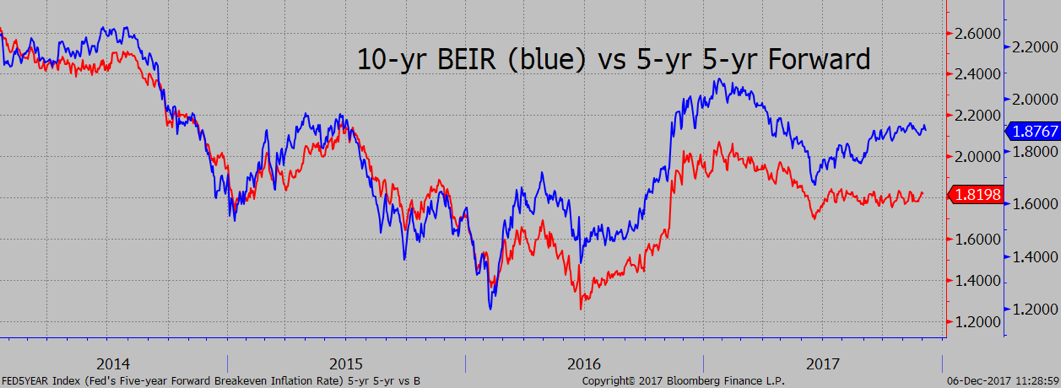
It’s not solely about the Fed or Treasury issuance, however. The infamous market measures of inflation compensation remain remarkably stable as evidenced by Break Even Inflation Rates and the Fed’s own 5-yr/5-yr forwards. The market doesn’t have the same angst over inflation as the Fed. This also hints that the market thinks the Fed may be getting too aggressive.

I buy that argument. Fed officials have warned about elevated asset prices, the risk of stimulus when the economy was already near full employment, expectations that wages would pick up, but, frankly, offered scant evidence that inflation really is bubbling. It may be premature to say the Fed is too aggressive, but more aggressive is sufficient for the yield curve’s behavior.
What will it look like in a year’s time? I err on the side of a 2 percent funds rate next December. The 10s/Funds spread has been trading around 110 bps for the last several months. I think that could narrow to 50-60 bps in a year for a 2.50-60 percent, 10-year note. At least for the 10-year sector that’s nothing dramatic, but the slightly higher rate does accommodate added supply, from the Fed curtailing reinvestment and generic deficit financing and even a wee bit of inflation.

There will be a point where all this flattening will compel Treasury to shift its view on holding the average maturity at current levels and extend it via more long-term issuance and the addition of 40- or 50-year paper. Isn’t that what prudent debt management is about, especially given where the deficit is likely to be in a very short time? That doesn’t detract in the slightest, from a strategic view, from more flattening in the coming year, perhaps coming two years. But, let’s keep it on the radar.
David Ader is Chief Macro Strategist for Informa Financial Intelligence.


