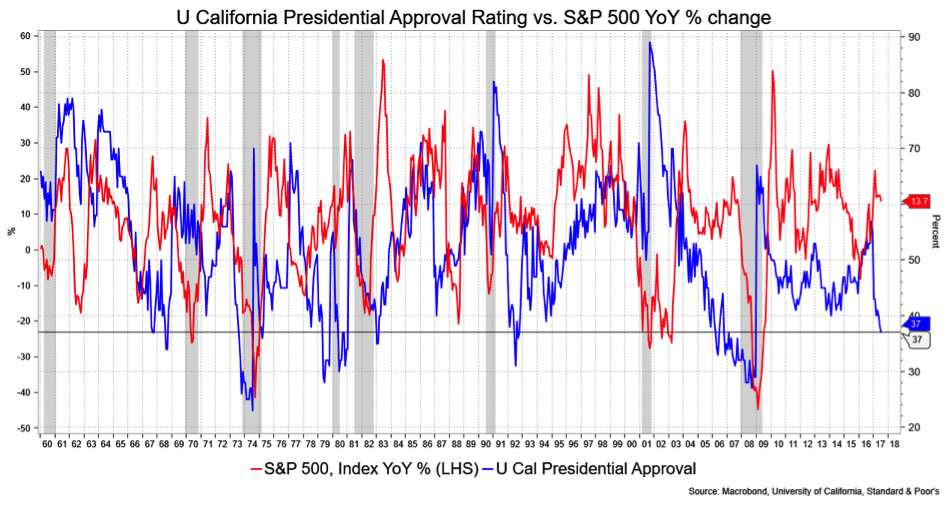
Trump is right—Obama really screwed things up. However, per the chart below, what he screwed up was the correlation between a low presidential approval rating and gains to the stock market. Trump’s remarkably low approval rating this early in his term (or at any point in a presidential term, for that matter) tends to be a harbinger of stress vis-a-vis equity returns. In fact, the correlation has been historically very good.

Exceptions are there. For example, after Nixon resigned, Ford’s approval rating soared even as stocks soured. Likewise, George Bush the younger did very well after 9/11, while stocks sold off. Obama’s approval rating held pretty much between 40 and 50 percent from 2010 onward, while the S&P 500 maintained quite solid gains year over year, generally north of 10 percent.
And then there’s Trump. Here at 37 on the University of California presidential approval poll, you would think we were on the cusp of a breakdown in stocks, especially so early in his term. I’ll offer up the cheap phrase "time will tell" to suggest that time will tell. A rating of 37 is, like it or not, very low. While the chart shows that stocks have made gains when the rating was low in the past, generally it appears to come after a prior plunge (think the Nasdaq bubble or the global crisis) or toward the evident end of a president’s stay at the big house. I mean White House. In short, this looks quite different, which is to say unprecedented. At least for the time being.
David Ader is chief macro strategist for Informa Financial Intelligence.


