From the start, avoid any ETFs below a $100 million market cap. Anything smaller puts you at risk of inadequate liquidity, too large a bid/ask spread and tracking error. Even $100 million can be too low. The bigger the market cap the less trading risk. There are plenty of free services that allow you to screen out the smaller ETFs and minimize your trading risk.
The focus of this article, however, is investing risk or the relative investment potential of the ETF. This risk is much more difficult to asses because it requires researching the investment potential of the ETFs holdings.
Contrary to the numerous screens on market cap and other technical measures, there are very few services (free or not) that evaluate the quality of the holdings of an ETF.
You cannot rely on the ETF label/name to accurately reflect the holdings of the ETF. Moreover, investors should not expect ETFs with the same label to have the same holdings.
I rolled up my sleeves and analyzed the holdings of several ETFs. Well, I did a little more than roll up my sleeves. The point is I analyzed the holdings of lots of ETFs to derive ratings on ETFs based primarily on my stock ratings of their holdings.
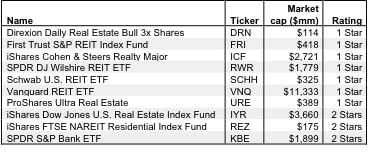
Figure 1 shows the worst ten financial sector ETFs with a market cap over $100 million. Seven of these ETFs get my 1-star or Very Dangerous rating. They get my worst rating because they allocate so much of their assets to stocks that are rated Dangerous or Very Dangerous. The largest ETF by market cap in Figure 1,Vanguard REIT ETF [s: VNQ], allocates 87% of its assets to Dangerous-or-worse stocks. My sample report VNQ has the details.
The worst-rated financial sector ETF, Direxion Daily Real Estate Bull 3x Shares [s: DRN], also allocates about 87% of its assets to Dangerous-or-worse stocks. It ranks worse than VNQ because it has a higher expense ratio of 0.95% compared to 0.12% for VNQ. Also, the 3x leverage in this ETF makes it even riskier.
Honestly, when the ETFs are invested so heavily in bad stocks, the expense ratio is the least of your problems. More details on why quality of holdings is more important than expenses are here.
I recommend investors avoid all the ETFs in Figure 1 and all 48 financial sector ETFs I cover. I do not recommend investors buy any ETFs with a 3-star rating or lower. For more details on financial sector ETFs, see my rankings on all 48 US equity financial sector ETFs.
Figure 1: Worst 10 Financial Sector ETFs
My ETF rating also takes into account the total annual costs, which represents the all-in cost of being in the ETF. This analysis is simpler for ETFs than funds because they do not charge front- or back-end loads and transaction costs are incurred directly. There is only the expense ratio, which is normally quite low. However, I penalize those ETFs with higher costs. Ergo, DRN ranks worse than VNQ though their stock selection is about the same.
One of the largest holdings in the ETFs in Figure 1 is Simon Property Group [s: SPG], which gets my Very Dangerous rating. It gets my worst rating because its reported earnings are misleading and its valuation is too expensive.
The company’s reported earnings are misleading because they are positive and rising while its economic earnings are negative and declining. The misdirection in GAAP earnings comes from the fact that the company is growing its balance sheet faster than its income. Capital is going at the door at a faster rate than income is coming in.
As a result, the return on invested capital (ROIC) of the company is falling and the company destroys value at an increasing rate. I would not be surprised if lots of write-offs are announced in the future as management’s investments are not pulling their economic weight.
In light of management’s capital allocation challenges, the valuation of the stock looks way too high. At $144.73/share, the current valuation implies the company will grow its after-tax cash flow (NOPAT) at 20% compounded annually for 10 years. Since 1998, the company has achieved double-digit revenue growth only twice and has grown NOPAT at about 9% compounded annually. For the stock to be fairly valued, you have to believe that the company’s NOPAT growth will be more than twice what it has done in the past. With so many other attractively valued and profitable companies to choose from, I recommend investors sell this SPG.
The company’s reported earnings are misleading because they are positive and rising while its economic earnings are negative and declining. The misdirection in GAAP earnings comes from the fact that the company is growing its balance sheet faster than its income. Capital is going at the door at a faster rate than income is coming in.
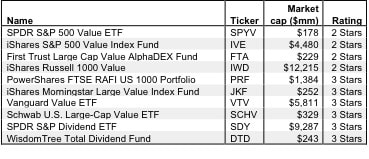
Figure 2 shows my ranking of the worst ten large-cap value ETFs with a market cap over $100 million based on the quality of their holdings. Here are my rankings on all 39 US equity large cap value ETFs.
Figure 2: Worst 10 Large Cap Value ETFs as of 3/30/12
The worst large cap growth ETF is SPDR S&P 500 Value ETF [s: SPYV]. It gets my 2-star or Dangerous rating because it allocates 38% of its value to Dangerous and Very Dangerous stocks. Only 26% of its value goes to Attractive-or-better rated stocks. The remainder of its holdings gets my Neutral rating. SPDR S&P Dividend ETF [s: SDY] gets a 3-star or Neutral rating because it does not allocate enough of its value to Attractive-or-better rated stocks. Almost 60% of this ETF goes to Neutral-or-worse-rated stocks.
One of the more common holdings in the large cap value ETFs in Figure 2 is AT&T [s: T], which gets my Dangerous rating. With a bottom-quintile ROIC of 3.5%, AT&T is a perennial value destroyer. Not since 1998 has the company’s ROIC been greater than its weighted-average cost of capital (WACC). In 2011, its ROIC dropped from 1.2% from 4.7% n 2010. I do not think the company is going to turn its business around. This company was broken up in the past when it got too big and I think that might be the best thing for it in the future.
Seemingly oblivious to its value-destroying ways, the valuation of the stock (at ~$31) implies the company will grow profits at about 7% for over ten years. I would not bet on that.
If you like this approach to finding the worst ETFs, you can get more rankings at my ETF screener. To find the best ETFs, see “How To Find the Best ETFs“.
Disclosure: I receive no compensation to write about any specific stock, sector or theme.


