The Mid-cap Blend style ranks seventh out of the twelve fund styles as detailed in my Style Rankings for ETFs and Mutual Funds report. It gets my Dangerous rating, which is based on aggregation of ratings of 17 ETFs and 307 mutual funds in the Mid-cap Blend style as of May 2, 2013. Prior reports on the best & worst ETFs and mutual funds in every sector and style are here.
Figures 1 and 2 show the five best and worst-rated ETFs and mutual funds in the style. Not all Mid-cap Blend style ETFs and mutual funds are created the same. The number of holdings varies widely (from 20 to 3004), which creates drastically different investment implications and ratings. The best ETFs and mutual funds allocate more value to Attractive-or-better-rated stocks than the worst, which allocate too much value to Neutral-or-worse-rated stocks.
To identify the best and avoid the worst ETFs and mutual funds within the Mid-cap Blend style, investors need a predictive rating based on (1) stocks ratings of the holdings and (2) the all-in expenses of each ETF and mutual fund. Investors need not rely on backward-looking ratings.
My fund rating methodology is detailed here.
Investors should not buy any Mid-cap Blend ETFs or mutual funds because none get an Attractive-or-better rating. If you must have exposure to this style, you should buy a basket of Attractive-or-better rated stocks and avoid paying undeserved fund fees. Active management has a long history of not paying off.
Get my ratings on all ETFs and mutual funds in this style on my free mutual fund and ETF screener.
Figure 1: ETFs with the Best & Worst Ratings – Top 5
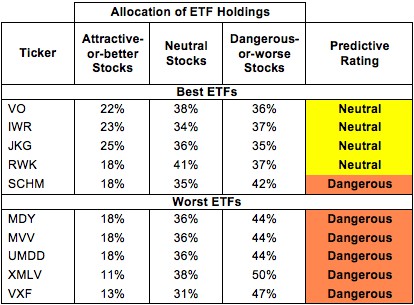 * Best ETFs exclude ETFs with TNAs less than $100 million for inadequate liquidity.
Sources: New Constructs, LLC and company filings
PowerShares RAFI Fundamental Pure Mid Core Portfolio (PXMC) and Guggenheim Russell Midcap Equal Weight ETF (EWRM) are excluded from Figure 1 because their total net assets (TNA) are below $100 million and do not meet our liquidity standards.
Figure 2: Mutual Funds with the Best & Worst Ratings – Top 5
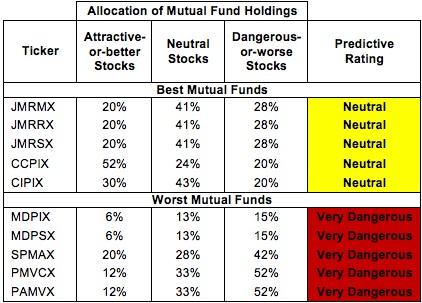 * Best mutual funds exclude funds with TNAs less than $100 million for inadequate liquidity.
Sources: New Constructs, LLC and company filings
Three mutual funds are excluded from Figure 2 because their total net assets (TNA) are below $100 million and do not meet our liquidity standards.
Vanguard Mid-Cap ETF (VO) is my top-rated Mid-cap Blend ETF and JP Morgan Mid Cap Core Fund (JMRMX) is my top-rated Mid-cap Blend mutual fund. For the majority of investors priced out by JMRMX’s $15 million initial minimum, JMRRX offers the same holdings for only slightly higher costs. All three earn my Neutral rating.
Vanguard Extended Market ETF (VXF) is my worst-rated Mid-cap Blend ETF and Pacific Advisors Fund Inc: Mid Cap Value Fund (PAMVX) is my worst-rated Mid-cap Blend mutual fund. VXF earns my Dangerous rating and PAMVX earns my Very Dangerous rating.
I am astonished that no ETFs or mutual funds earn an Attractive rating in this style given that Attractive-or-better rated stocks make up 22% of the market value of stocks in the style.
The takeaway is: mutual fund managers allocate too much capital to low-quality stocks and Mid-cap Blend ETFs hold poor quality stocks.
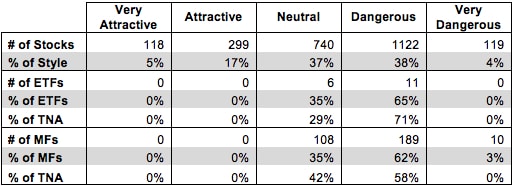
Figure 3: Mid-cap Blend Style Landscape For ETFs, Mutual Funds & Stocks
As detailed in “Cheap Funds Dupe Investors”, the fund industry offers many cheap funds but very few funds with high-quality stocks, or with what I call good portfolio management.
Investors should avoid Mid-cap Blend ETFs and mutual funds. 65% of both ETFs and mutual funds in the Mid-cap Blend style are rated Dangerous-or-worse. No Mid-cap Blend ETFs or mutual funds allocate enough value to Attractive-or-better rated stocks to earn an Attractive rating, so investors should focus on individual stocks instead.
Parker Hannifin Corp (PH) is one of my favorite stocks held by Mid-cap Blend ETFs and mutual funds and earns my Very Attractive rating. PH has grown after tax profit (NOPAT) by over 20% compounded annually for the past decade. PH is an extremely well diversified company, providing motion and control technologies for aerospace, medical, heavy industrial, agricultural, and military consumers. The company’s 14% return on invested capital (ROIC) attests to its ability to bring in revenues from a variety of sources while keeping costs low.
PH has an enticingly cheap valuation to go along with its strong track record of profits. At its current valuation of ~$87.20/share, PH has a price to economic book value ratio of only 1.0, implying zero future growth in NOPAT. Investors should not be overly concerned about PH’s reported earnings miss last quarter. Quarterly reports are unaudited, do not include the Financial Footnotes, and cover a relatively short time frame, making them generally unreliable indicators of the true profitability of a company. Long-term, it seems unlikely that PH will reverse its trend of profit growth and never grow NOPAT again as its valuation implies. PH’s well-diversified business and consistent track record should give investors a great deal of confidence.
United Rentals, Inc. (URI) is one of my least favorite stocks held by Mid-cap Blend ETFs and mutual funds and earns my Very Dangerous rating. URI has had negative economic earnings in every year since my model begins in 1998. Bad investments explain a significant portion of URI’s struggles. In 2011, prior to its acquisition of RSC Equipment Rentals, URI had accumulated asset write-downs equal to over 55% of its net assets. That percentage decreased in 2012 as URI added a significant amount of assets via the RSC acquisition without increasing write-downs. Given URI’s track record, however, I would not be surprised to see more write-downs in the future due from this recent acquisition, especially as it recorded $2.7 billion of goodwill.
Even if its investments do succeed at a higher rate than usual, URI’s valuation presents a high hurdle for the company to clear before the stock can reward investors. To justify its current share price of ~$50.83, URI would need to grow NOPAT by 16% compounded annually for nine years. Given that URI has only grown NOPAT by 9% compounded annually over the past nine years, the market’s expectation seems overly optimistic. URI’s track record of bad investments, combined with its expensive valuation, makes it a high risk/low reward prospect for investors.
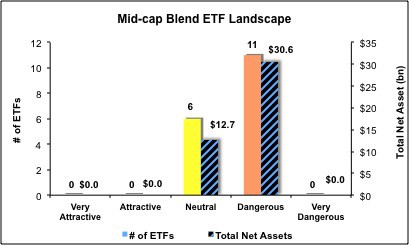
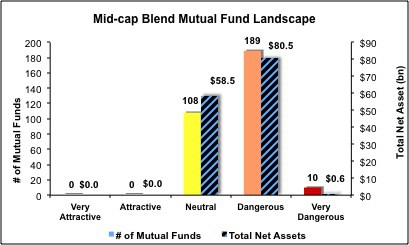
Figures 4 and 5 show the rating landscape of all Mid-cap Blend ETFs and mutual funds.
My Style Rankings for ETFs and Mutual Funds report ranks all styles and highlights those that offer the best investments.
Figure 4: Separating the Best ETFs From the Worst Funds
Figure 5: Separating the Best Mutual Funds From the Worst Funds
Review my full list of ratings and rankings along with reports on all 17 ETFs and 307 mutual funds in the Mid-cap Blend style.
Sam McBride contributed to this report.
Disclosure: David Trainer and Sam McBride receive no compensation to write about any specific stock, sector, style or theme.

