The all-cap value style ranks sixth out of the twelve fund styles as detailed in my style roadmap. It gets my Neutral rating, which is based on aggregation of ratings of two ETFs and 285 mutual funds in the all-cap value style as of April 24, 2012. Reports on the best & worst ETFs and mutual funds in every sector and style are on my blog.
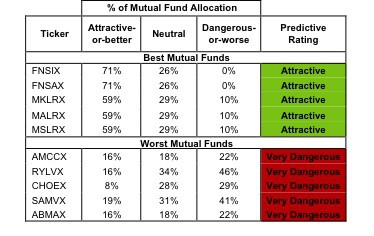
Figure 1 ranks from best to worst the only two all-cap value ETFs. Figure 2 shows the five best and worst-rated all-cap value mutual funds. The best ETFs and mutual funds allocate more value to Attractive-or-better-rated stocks than the wors, which allocate too much value to Neutral-or-worse-rated stocks.
To identify the best and avoid the worst ETFs and mutual funds within the all-cap value style, investors need a predictive rating based on (1) stocks ratings of the holdings and (2) the all-in expenses of each ETF and mutual fund. Investors need not rely on backward-looking ratings. My fund rating methodology is detailed here.
Investors seeking exposure to the all-cap value style should buy one of the Attractive-or-better rated mutual funds from Figure 2.
See ratings and reports on all ETFs and mutual funds in this style on my free mutual fund and ETF screener.
Figure 1: ETFs Ranked from Best to Worst
Figure 2: Mutual Funds with the Best & Worst Ratings – Top 5
* Best mutual funds exclude funds with NAV’s less than 100 million.
Sources: New Constructs, LLC and company filings
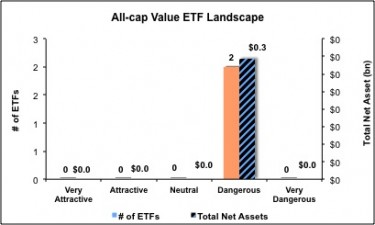
I recommend investors avoid both all-cap value ETFs because both earn my Dangerous rating.
FundVantage Trust: Formula Investing US Value Select Fund [s: FNSIX] is my top-rated all-cap value mutual fund and earns my Attractive rating.
First Trust Multi Cap Value AlphaDEX Fund [s: FAB] is my worst-rated all-cap value ETF and earns my Dangerous rating. American Beacon Funds: American Beacon Mid-Cap Value Fund [s: ABMAX] is my worst-rated all-cap value mutual fund and earns my Very Dangerous rating.
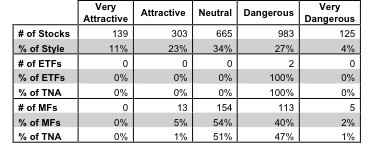
Figure 3 shows that 442 out of the 2215 stocks (over 34% of the total net assets) held by all-cap value ETFs and mutual funds get an Attractive-or-better rating. However, neither of the two all-cap value ETFs and only 13 out of the 285 all-cap value mutual funds (less than 1% of total net assets) get an Attractive-or-better rating.
The takeaways are: mutual fund managers allocate too much capital to low-quality stocks and all-cap value ETFs hold poor quality stocks.
Figure 3: All-cap Value Style Landscape For ETFs, Mutual Funds & Stocks
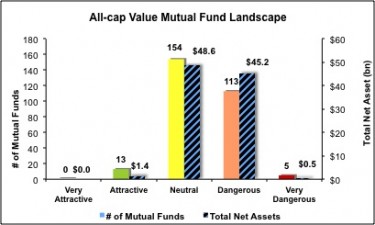
Investors need to tread carefully when considering all-cap value ETFs and mutual funds, as both ETFs and 95% of mutual funds are not worth buying. Only 11 mutual funds in the all-cap value style allocate enough value to Attractive-or-better-rated stocks to earn an Attractive rating.
Altria Group, Inc. [s: MO] is one of my favorite stocks held by all-cap value ETFs and mutual funds and earns my Very Attractive rating. MO has a return on invested capital (ROIC) of 14% and has consistently generated positive economic earnings for shareholders since at least 1998. While reported earnings for MO dropped by 13% in 2011, diligent investors who reviewed the financial footnotes know that MO’s economic earnings actually rose by 11% in 2011. MO’s current stock price of $31.76 implies that the company’s profits will decline by 10% permanently, which is unlikely given the company’s strong historical performance. Since I discussed why I like MO here, the stock is up over 5.5% while the S&P 500 is flat. Diligence pays.
Essex Property Trust, Inc. [s: ESS] is one of my least favorite stocks held by all-cap value ETFs and mutual funds and earns my Very Dangerous rating. ESS has misleading earnings, which means that its reported earnings are positive and rising while its economic earnings are negative and declining. In fact, ESS has only once in the last 14 years generated positive economic earnings. It’s a value destroyer that investors should avoid.
As detailed in “Cheap Funds Dupe Investors”, the fund industry offers many cheap funds but very few funds with high-quality stocks, or with what I call good portfolio management.
Figures 4 and 5 show the rating landscape of all all-cap value ETFs and mutual funds.
Our style roadmap report ranks all styles and highlights those that offer the best investments.
Figure 4: Separating the Best ETFs From the Worst Funds
Figure 5: Separating the Best Mutual Funds From the Worst Funds
Review my full list of ratings and rankings along with free reports on both ETFs and 285 mutual funds in the all-cap value style.
Disclosure: I receive no compensation to write about any specific stock, sector, style or theme.


