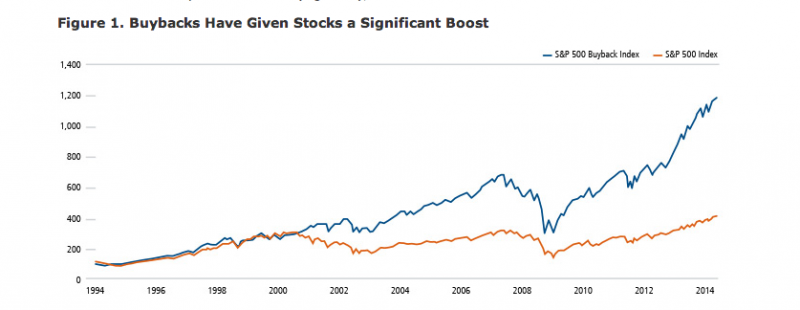
We believe finding stocks that deliver sustainable growth in their core businesses (via volume growth, pricing, or margin expansion that exceeds investor expectations) is the surest way to deliver outperformance, and it’s where we at Calamos spend the bulk of our research efforts. That said, we believe we also often add value by correctly anticipating change in a company’s cash reinvestment strategy—specifically, by identifying companies that will use their excess cash flow to buy back stock when there is a significant difference between a stock’s earnings yield (E/P) and the company’s after-tax cost of debt or cash. As research by Jeffries shows (Figure 1), this can create substantial value for shareholders as well.

Theory says a company should buy back stock if the internal rate of return on equity free cash flows exceeds the company's marginal cost of capital, assuming no better uses of the cash and no financial duress.
From an accretion standpoint, buybacks are accretive if the forward earnings yield (E/P) exceeds the marginal after-tax cost of debt or cash. If the marginal cost of debt is 3.9%, the P/E on next year's earnings is 15.6x, and the tax rate is 35%, then the return on buybacks is E/P = 1/15.6x = 6.4% versus a 2.5% after tax-cost of debt. This particular buyback would be very accretive to equity holders.
Mathematically, the actual year 1 accretion formula can be spelled out as follows: % accretion = {$ repurchased/market cap} x {1 – [(cost of debt x (1-tax rate))/(E/P)]}*
If the year 1 buyback is 8% of market capitalization, the 2015 P/E is 15.6x, and the after-tax cost of debt is 2.5%, then accretion would be: 8% x [1 - (2.5%/6.4%)] = 4.8%.
All other things being equal, if the buyback is unanticipated, EPS and the stock price should rise by about 4.8% on such an announcement. However, if the market already expects a year 1 buyback of 5% and the company announced a year 1 buyback of 8%, EPS estimates and the stock price would increase by a still-not-shabby 1.8%, based on: {(8% - 5%) x [1 - (2.5%/6.4%)]} = 1.8%. As the P/E goes up or the cost of debt increases if the firm is perceived as riskier, the efficacy of buybacks obviously diminishes.
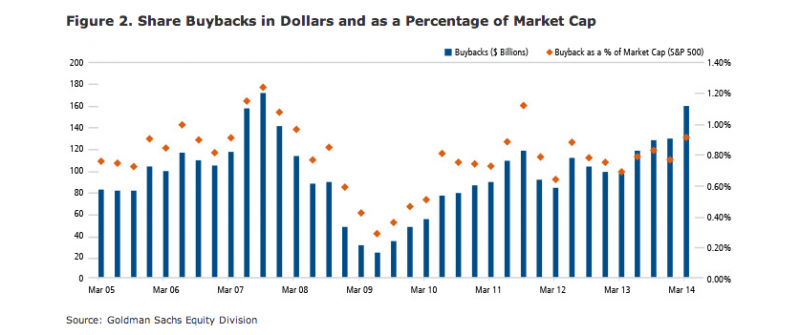
In dollars, share buybacks are now at their highest level since 2007 (see Figure 2). As a percentage of market capitalization, buybacks are at their highest level since the third quarter of 2011. We expect the heightened buyback activity to continue in the quarters ahead, given yields of 3.4% for A-rated 10-year corporate paper and 3.9% for BBB-rated 10-year paper (2.5% after-tax with a tax rate of 35%), and a 6.4% S&P 500 earnings yield (based on the S&P 500 Index selling at 1930/$124 EPS for a 15.6x P/E on 2015 estimates).

In short, we believe that share repurchase activity by CEOs and CFOs, who are closer to the fundamentals of their businesses than anyone, is a good indicator of a stock's future direction.
* Some investors adjust the buyback equation for the percentage reduction in shares — that is, divide the accretion by (1 - % share reduction), which tends to inflate the accretion impact. We take the view that when a company buys back stock, the buyback will increase the stock price by the amount of the share reduction, and so we don’t adjust accretion for the % share reduction.
Past performance is no guarantee of future results. The opinions referenced are as of the date of publication and are subject to change due to changes in the market or economic conditions and may not necessarily come to pass. Information contained herein is for informational purposes only and should not be considered investment advice.
Opinions, estimates, forecasts, and statements of financial market trends that are based on current market conditions constitute our judgment and are subject to change without notice. We believe the information provided here is reliable. The views and strategies described may not be suitable for all investors. References to specific securities, asset classes and financial markets are for illustrative purposes only and are not intended to be, and should not be interpreted as, recommendations.
Internal rate of return is a discount rate often used in capital budgeting that makes the net present value of all cash flows from a particular project equal to zero. Price to earnings ratio (P/E) is a valuation ratio of a company's current share price compared to its per-share earnings. Earnings per share (EPS) is a company’s profit divided by its number of common outstanding shares. Earnings yield (or E/P) is the earnings per share for the most recent 12-month period divided by the current market price per share and shows the percentage of each dollar invested in the stock that was earned by the company. Equity free cash flow is cash generated annually for shareholders after payment of certain non-discretionary expenses. Marginal cost of capital is the cost of the last dollar of capital raised. (Sources: Investopedia.com, moneyweek.com.) Indexes are unmanaged, do not include fees and expenses and are not available for direct investment.
Gary Black is Executive Vice President and Global Co-Chief Investment Officer at Calamos Investments