

Just how actively managed is your actively managed mutual fund? And, more importantly, what’s the real pay-off for all that activity?
These long-standing questions took center stage with the recent publication of research on the so-called “active share” metric. Simply put, active share represents the percentage of a portfolio that varies from a fund’s benchmark index. It’s derived by comparing the fund’s security weightings to those of a benchmark. Prior to the mathematical quantification of active share, the extent and the cost of active management had to be inferred from a fund’s performance.
Equity funds can be thought of as two portfolios in one wrapper. The first, a “passive” component that holds the benchmark securities, much like an index fund, and the second, the “active” part that’s made up of securities held in weights that differ from the benchmark’s, or even outside of it. The passive segment provides beta, or market exposure, while the active element is the alpha engine which aims for outperformance.
Active share is advertised as a gauge of the appropriateness, or “fit,” of various benchmarks as well as a measure of consistency in a fund’s investment strategy. Early studies seemed to indicate that funds with high active share values outperformed portfolios with low values, though follow-on research has thrown doubt on that notion.
There are inherent problems with the active share construct. First of all, you need to monitor the fund’s and the benchmark’s portfolio in real time in order to assess consistency, a feat not easily accomplished by retail investors or their brokers. Additionally, stock-by-stock analysis is required, a laborious procedure when the benchmark holds hundreds or thousands of issues.
Active share readings, too, can unduly brand a fund. High active share readings can result when funds use representative sampling rather than full replication to obtain beta exposure. This is particularly true of funds with risk control mandates.
Perhaps more importantly, most fund sponsors don’t publish active share readings. No matter how useful this information may be, it’s hard to access.
On the other hand, the level and expense of active management can be transparently ascertained through performance. Using nothing more than an r-squared (r2) correlation (the measurement of how much of a portfolio’s movement can be explained by movement in a benchmark) the size of a fund’s active bet and its cost can easily be quantified.
Whether or not you favor a portfolio- or performance-based measure of active management really depends on your willingness to include a “duck test” in your analysis. The test’s premise is simple: If a fund acts like it’s actively managed, to some extent or another, it probably is. Active share relies upon strict anatomy; performance-based measures concentrate on fund behavior.
Investors and their advisors must consider the quality of the information conveyed by these measures. Do any of them explain enough of a portfolio manager’s outcomes to aid in asset allocations? And are these measures in any way predictive of future results?
Research published this year by Fidelity (“Active Share: A Misunderstood Measure in Manager Selection”) showed that excess returns do seem to increase with a high active share, but so, too, does downside risk. Put another way, divergence from a benchmark doesn’t necessarily equate with outperformance. Fidelity, as well, says active share doesn’t foretell excess returns.
Fidelity’s research confirms the findings made by Vanguard in 2012 (“The Search for Outperformance: Evaluating ‘Active Share’”). Vanguard found that funds with the highest active share levels tend to be more concentrated in mid- and small-capitalization stocks and, not surprisingly, that higher active share is correlated with higher fund costs.
A Barron’s cover story last year (“Is Your Fund Manager Active Enough?”) assessed the active share of 25 large domestic mutual funds and found the big funds aren’t very adventurous. The megafunds—the five largest portfolios—averaged a middling 60 percent active share (early on, researchers posited a 60 percent breakpoint to distinguish high-active share portfolios from less active funds).

While active share can give us some insight into just how active a fund manager is, and whether that activity is worth the cost, we can look at funds across a wider universe of active management and risk measures to see if we can shed even more light on the effects and implications of their investment strategies.
First of all, a primer on the available metrics:
R-squared (r2): Ranging between 0 and 100, the r-squared coefficient represents the percentage of a fund’s movements “explained” by movements in its benchmark. More actively managed funds tend to have lower r-squared values. Higher values, say between 85 and 100, indicate performance patterns more in line with the benchmark.
Tracking Error: Tracking error measures, as a standard deviation, the difference between a fund’s return and that of its benchmark. The higher the tracking error, the greater the variance from the index.
Sharpe Ratio: A global measure of a portfolio’s risk-adjusted returns, the Sharpe ratio indicates the payback earned for a fund’s volatility. A “good” reading is 1, meaning a one-to-one payback: one unit of return earned for each unit of total risk. A ratio of 2 is considered “very good” and a value of 3 or higher is “excellent.”
Information Ratio: The information ratio meters how many units of return are earned for each unit of tracking error. The higher the ratio, the greater the return earned through active management. Conventionally, a ratio of 0.5 is “good,” 0.75 is “very good” and 1 or better is “excellent.”
Active Weight: The portion of a fund’s portfolio, implied by its r-squared coefficient, that varies from the benchmark. Developed by Ross Miller (“Measuring the True Cost of Active Management by Mutual Funds”), the
metric relies on performance rather than portfolio construction to determine the level of active management.
Alpha: Alpha measures the payback earned over a fund’s expected return. A negative alpha coefficient indicates the fund earned too little for the risk undertaken while a positive value bespeaks a fund that garnered a return in excess of the reward for the risk assumed.
Active Alpha: Using Miller’s methodology, alpha can be deconstructed to find how much, if any, was earned from the active portion of the portfolio. Active alpha more directly reflects the manager’s stock-picking skill.
Active Expense: The “true cost” of active management found by allocating fund expenses between the active and passive components. The cost is implied through a fund's published expense ratio, its r-squared coefficient and the expense ratio for a competitive index fund.

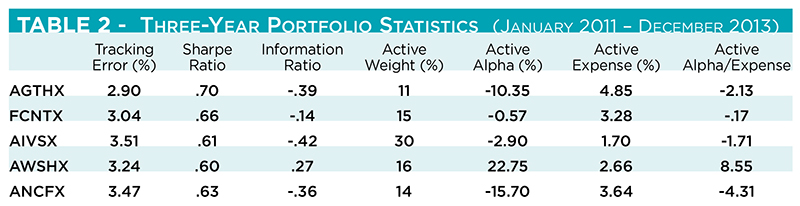
If we were considering funds from this field to fill a large-cap allocation without a value or growth tilt, we’d have to decide between AIVSX and ANCFX. Here, active share doesn’t help us at all. Both funds have the same 60 percent reading, despite radically different r-square coefficients and active weights. ANCFX may have had a marginally better three-year return, but the other portfolio characteristics tell us the smaller fund could be a worse bet for the future. While neither fund produced positive active alpha, the value for AIVSX is the least noxious. That, coupled with a lower active expense, makes AIVSX more attractive. AIVSX managers seem to make bigger active bets and get closer to making them pay off than ANCFX’s portfolio runners.
Clearly, there’s lot more granularity obtained by using a suite of portfolio metrics. Active share may point to some degree of active management in a portfolio, but other measures give better, and more transparent, detail.