
Name an asset you could have recommended to your clients 10 years ago that would have earned them a compounded annual return of 17.6 percent and would have gained ground for nine of those 10 years. Oh, and that losing year? The setback would have been just 1.5 percent.

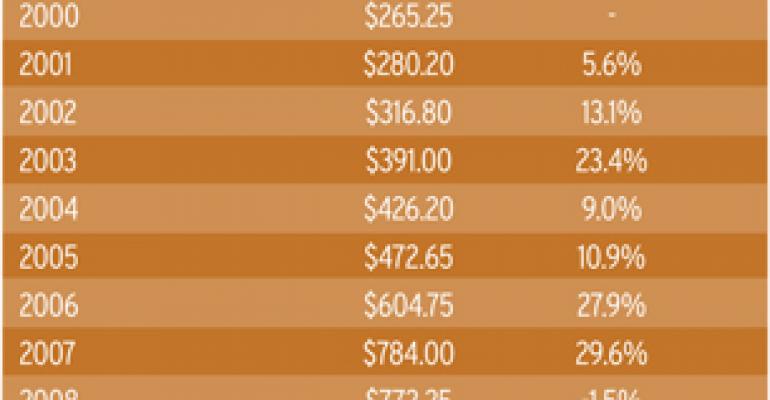
The answer's a cinch. The clue, of course, is in this article's title. It's gold. Heading into the 2000 elections, bullion was worth $265 an ounce. On the eve of the mid-term 2010 vote, gold changed hands at $1,337.
Since this year's election results were tallied and the dimensions of the Federal Reserve's second round of quantitative easing were announced, gold prices have gyrated wildly. A precipitous plunge followed by a screaming ascent to new nominal highs left traders reeling and prompted analysts to wonder anew if the gold market was poised for a leap to higher ground or was, in fact, stumbling about in the terminal stage of a decade-long bull run. Some are puzzling at the possibility of a bubble burst in gold prices.
That question's been debated for some time now. Comparisons of bullion's run to the dot.com mania of the 1990s abound and, in fact, bear some startling similarities. The endgame for the tech stock (and other asset) bubbles is typically characterized by extremes in the magnitude and the velocity of price changes. A bubble is confirmed when prices rise sharply in a short period of time, then drop sharply in an equally short period of time.
Gold certainly spiked sharply higher in the wake of the recent QE2 announcement, but bullion's path hasn't yet traced the pattern that usually precedes a blow-off top. Emphasis on the word “yet.”
Look back at gold's bull run, starting in 2001, and compare it with that of the Nasdaq Composite in the 1990s (See Chart 1) There's a remarkable resemblance. Presently, gold's bull market is 118 months old and, using as a cost basis the London morning fix at October's end, it has bestowed a 501 percent gain on bullion holders. The technology-laden Nasdaq Composite had appreciated 713 percent when it was 118 months into its run-up. At that point, the Nasdaq was just four months shy of its ultimate top — a gain of 1,130 percent from its January 1990 base. Those last four months were some of the Nasdaq's most volatile. The index exhibited an annualized volatility of 19.3 percent over the preceding decade, but its standard deviation ballooned to 34.5 percent in the terminal trimester of its bull run.

Gold's volatility over the past decade has been a relatively quiescent 17 percent per annum, less than that of the contemporaneous equity market. And the new highs scored by gold aren't running far ahead of bullion's average price. When a market reaches toward a frothy apex, prices typically advance faster than average, but gold's recent highs have been scored well within the metal's normal volatility pattern.
Over the past decade, gold's new highs have been notched when bullion has traded 17 percent above its 10-month moving average. New highs in September and October were just 12 percent and 15 percent, respectively, above the metal's average price.
With all this in mind, history suggests that gold needs an even steeper price climb to form a proper bubble — the final inflation before the inevitable pop. That prices will eventually fall is a virtual certainty. The question is when. And from what level.
Let's deal with the level part first. There is a large contingent of gold aficionados who believe that gold will converge upon its inflation-adjusted high set back in January 1980. A London fix of $850 projected through 30 years of a rising Consumer Price Index puts the gold bugs' target at $2,253 presently.
Now, go back to the Nasdaq model. The rise in the last four months of the index's 2000 run-up was a whopping 58 percent. Bullion would need to notch a 69 percent gain to hit its inflation-adjusted high by the 122nd month of its bull run. Doable? One can't say it isn't possible. How probable, though?
The fundamentals which set gold on its present course — namely the debasement of the U.S. dollar together with the uncertainty and fear precipitated by global terrorism — have to be mitigated to significantly dull gold's luster. Gold's run isn't being fueled by a dearth of the metal, but rather out of a lack of faith in the greenback. That faith isn't likely to be restored in four months' time.
The evidence of gold's utility as the “anti-dollar” is described by its price trail in the world's other reserve currency, the euro. Since the common currency was launched in 1999, gold's price has climbed at a compound annual rate of 14.6 percent in dollars. Gold's appreciation in euro terms has been just 12.9 percent per annum since 1999. The new highs now being lodged by bullion in dollars aren't being matched by new euro records. Gold's top price in the Eurozone currency was scored back in June and hasn't yet been exceeded.
By the second week of November, a near-term technical target for spot gold could be fixed at $1,461 to $1,462, but there's a distinct prospect of an overshoot whenever momentum traders jump aboard the gold train.
Now let's consider the “when” part …
The Warning Signs
There will likely be early warning signs of a shift in gold market dynamics before a blow-off occurs. The so-called “smart money” — — the hedge funds and institutional accounts that have been driving investment demand for bullion — may tire of gold at some point, for fear of diminishing returns or simply to exploit better opportunities in other markets. When the hedgies leave, the gold market will be left to smaller speculators.
We've, in fact, seen a bit of that already. The net speculative length of the COMEX gold futures market fell in October after weeks of unabated expansion. Long positions held by all speculators — large together with small — dipped by 9 percent in time for Halloween. Parsing the trader commitment data reveal the outflow was actually an exodus of money managers from the gold market. The number of funds holding long positions in gold futures fell 9 percent while the fund runners lightened their net long contract commitments by 12 percent.
While institutions and hedge funds exited the market, small speculators increased their long gold exposure. There was a 5 percent uptick in the size of small speculators' net long position in October. The influx of small speculators filling a vacuum left by large traders typically speaks of a late-stage bull market. The little guy gets in last. We ought to see even more dramatic evidence of retail Johnny-come-latelys in the marketplace near the ultimate top of the gold market.
That's not to say that funds have lost all their interest in gold presently. Of the present positions held by money managers, 94 percent are still long (Chart 2). At one point earlier this year, virtually all gold positions held by funds were purchases, but other opportunities now beckon fund capital.
The exodus of capital was also featured in the SPDR Gold Shares Trust (NYSE Arca: GLD). There's been a dissonance between gold — and, consequently, GLD — prices and recent capital flows into the trust. As prices climbed in early October, the trust's Money Flow Index dropped precipitously — a harbinger of the price break that came at mid-month (Chart 3).
The Money Flow Index is a volume-weighted measure of the capital flows into and out of a security and indicates the strength or weakness of a current price trend. Trends are confirmed and likely to continue when the MFI moves in the same direction as prices. Divergence signals a likely change in the price trend.
In the week following Oct. 15, gold prices, mirrored by GLD, slumped nearly 4 percent. While prices have since recovered, the trust's MFI still remains relatively weak. We'll see more divergence in GLD's Money Flow Index when gold's ready to top out.
What Next?
Taking into account the foregoing, odds are there's still some time left in gold's run. And, as the Nasdaq bubble demonstrated, the biggest gains are made in the immediate run-up to the market top. This knowledge is likely to tempt the more adventurous to jump aboard the gold train for the last leg of its bullish journey — however long it may be. Cautious speculators will monitor early warning indicators for signs of topping.
Not all entrants to the gold market now are wild-eyed speculators, though. Some investors and their advisors will continue to seek out gold as a classic portfolio risk diversifier. That, however, is likely to be a disappointment as long as quantitative easing — or even the prospect of quantitative easing — affects the market.
Here is why: The goal of quantitative easing, stated or not, is the reflation of assets. The immediate impact of the Fed's announced Treasury purchase program was an upsurge in equity and gold prices. In fact, the correlation between gold and domestic stocks had been building long before the parameters of QE2 were laid down in November. By the start of November's second week, the 30-day rolling correlation between gold and the S&P 500 Composite had shot up to 68 percent. That's positive 68 percent. Now, nobody complains about positive correlations when both asset classes are rising in tandem. The phone calls come when they reverse trend.
Put succinctly, gold's effectiveness as a hedge is presently being compromised by the anticipation of Fed intervention. This could be short-lived phenomenon. Earlier this year, gold's correlation to blue chip stocks lingered above 80 percent for two weeks before heeling over. Still, gold has averaged a 22 percent correlation to the S&P benchmark this year. Again, that's a positive number.
All told, there's still some money — but less risk diversification — to be obtained from gold in the near-term. How “near” is “near,” however, is anybody's guess.