While stocks were relatively unchanged for the week of May 5-9, 2014, daily and intra-day volatility has been notable—the S&P 500 saw 1% intraday moves on Tuesday, Wednesday, and Thursday. The stock market volatility of the past few weeks seemed to shake the nerves of individual investors leading to a week of net outflows from funds that invest in U.S. stocks after seeing net inflows in five of the past six months, according to data from ICI.
The volatility we call “market storms” is likely to continue to be a characteristic of markets this year, caused by well-known factors, such as: geopolitical conflict in Russian border countries, slower economic growth in China, or a weak start to the year for the U.S. economy, among others, but also lesser-known factors like the Oklahoma earthquakes, solar flares disrupting communications, and the Ebola outbreak. So, while ongoing volatility with pullbacks of 5% or more is likely, a bear market—defined by a decline of 20% or more—is very unlikely in 2014. A key basis for our high degree of confidence in this forecast is an indicator with a flawless track record over the past 50 years: the yield curve.
Market participants have become worried about when the Federal Reserve (Fed) may start to hike short-term interest rates. Many market participants expect the Fed to begin rate hikes next year. But history shows that the start of rate hikes does not really matter that much to stocks after an initial dip and quick recovery. Instead, bull markets end and bear markets begin, as they did in 2000 and 2007, when the Fed pushes short-term rates above long-term rates. This is referred to as “inverting the yield curve.” For example, the S&P 500 peaked in 2000 and 2007 when the 3-month to 10-year yield curve was inverted by about 0.5% (3-month Treasury yields were about one-half of one percentage point above the yield on the 10-year Treasury note) [Figure 1].
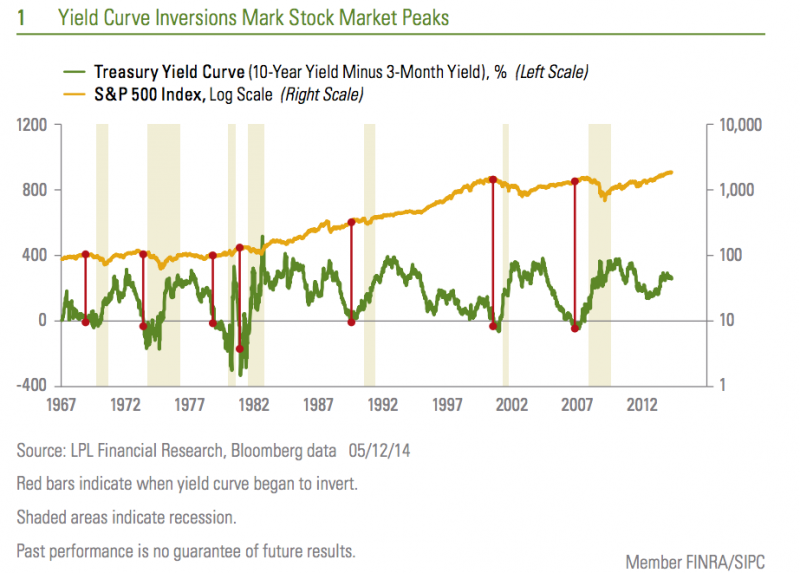
Why does an inverted yield curve signal a major peak for the stock market? Because every recession over the past 50 years was preceded by the Fed hiking rates enough to invert the yield curve. That is seven out of seven times—a perfect forecasting track record. The yield curve inversion usually takes place about 12 months before the start of the recession, but the lead time ranges from about five to 16 months. The peak in the stock market comes around the time of the yield curve inversion, ahead of the recession and accompanying downturn in corporate profits.
How far the Fed must push up short-term rates before the yield curve inverts by 0.5% depends on where long-term rates are. Even if long-term rates stay at the very low yield of 2.6%, to invert the yield curve by 0.5% the Fed would need to hike rates from around zero to over 3%! Based on the latest survey of current Fed members that vote on rate hikes, conducted earlier this year, members do not expect to raise rates above 3% until sometime in 2017, at the earliest. The facts suggest the best indicator for the start of a bear market may still be a long way from signaling a cause for concern.
While there are reasons the U.S. economy could experience a recession without first experiencing an inversion in the yield curve, the flawless track record earned over 50 years of varying economic, legislative, regulatory, geopolitical, and social conditions is a testament to the robust nature of the yield curve as an indicator. So while we do expect more volatility this year, we do not expect a bear market.
IMPORTANT DISCLOSURES
The opinions voiced in this material are for general information only and are not intended to provide specific advice or recommendations for any individual. To determine which investment(s) may be appropriate for you, consult your financial advisor prior to investing. All performance reference is historical and is no guarantee of future results. All indices are unmanaged and cannot be invested into directly. Past performance is no guarantee of future results.
The economic forecasts set forth in the presentation may not develop as predicted and there can be no guarantee that strategies promoted will be successful.
Stock and mutual fund investing involves risk including loss of principal.
The Investment Company Institute (ICI) is the national association of U.S. investment companies, including mutual funds, closed-end funds, exchange-traded funds (ETFs), and unit investment trusts (UITs). Members of ICI manage total assets of $11.18 trillion and serve nearly 90 million shareholders.
Yield Curve is a line that plots the interest rates, at a set point in time, of bonds having equal credit quality, but differing maturity dates. The most frequently reported yield curve compares the three-month, two-year, five-year and 30-year U.S. Treasury debt. This yield curve is used as a benchmark for other debt in the market, such as mortgage rates or bank lending rates. The curve is also used to predict changes in economic output and growth.
INDEX DESCRIPTIONS
The Standard & Poor’s 500 Index is a capitalization-weighted index of 500 stocks designed to measure performance of the broad domestic economy through changes in the aggregate market value of 500 stocks representing all major industries.
This research material has been prepared by LPL Financial.
To the extent you are receiving investment advice from a separately registered independent investment advisor, please note that LPL Financial is not an affiliate of and makes no representation with respect to such entity.
Not FDIC or NCUA/NCUSIF Insured | No Bank or Credit Union Guarantee | May Lose Value | Not Guaranteed by any Government Agency | Not a Bank/Credit Union Deposit
Tracking # 1-272233 (Exp. 05/15)