
So, the Fed has spoken. The anticipation and the aftermath of Thursday’s shoe drop has left many investors and pundits reeling. Initially, the Fed’s inaction was a tonic. Then, as Janet Yellen’s words were parsed, Mr. Market took a pratfall.
Long-term investors can view these antics with steely-eyed resolve, but those with shorter investment horizons are understandably worried.
How are you supposed to position yourself in a market like this? Well, at the risk of sounding glib I’d say, “Very carefully.”
If you need to reallocate, at least wait ‘til the odds are in your favor. A lot of technical signals flashed red ahead of the weekend, but a headlong jump into the bond pool may be premature. It’s still filling, cyclically speaking.
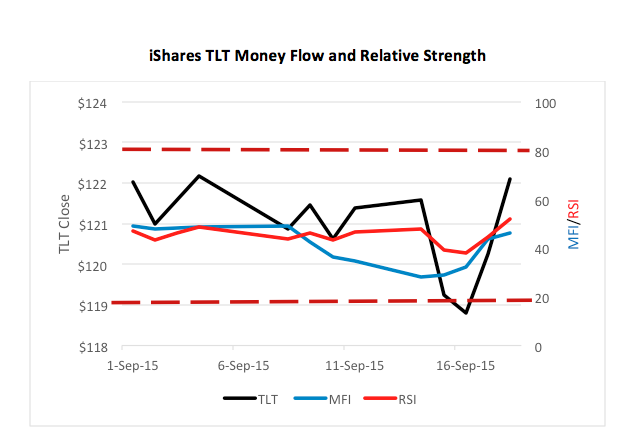
Take a look at the month’s price action for the iShares 20+ Year Treasury Bond ETF (NYSE Arca: TLT). The fund has been in a secular downtrend since its January peak above $138. By the start of September, TLT had slipped to $122, though there have been bumps and dips which afforded momentum traders chances to jump aboard – short or long – to ride intermediary trends. On Friday, for example, followers of the fund’s 21-day exponential moving average (EMA) would have likely covered for a four percent gain on their 17-day shorts.
So what should you do?
Bide your time ‘til the Money Find and Relative Strength indices top out if you’re looking for a new short (that is, if you believe in higher rates) or wait even longer for both metrics to bottom if you’d rather be a buyer of bonds.

The Money Fund Index (MFI) measures buying and selling pressure and typically oscillates between 80 and 20, on a 0-to-100 scale. An MFI reading of 80 signals an overbought market while a 20 indicates an oversold condition.
The Relative Strength Index (RSI) tracks the speed of price changes and is also measured on a 0-to-100 scale, though overbought and oversold conditions are indicated by readings at 70 and 30, respectively.
The difference between the two? MFI is volume-weighted; RSI is not.
As of Friday, both indices were middling – RSI at 52 and MFI at 46. Not good entry points.
If you’re itching for a TLT trade, be patient. Let it come to you.
Brad Zigler is REP./WealthManagement's Alternative Investments Editor. Previously, he was the head of marketing, research and education for the Pacific Exchange's (now NYSE Arca) option market and the iShares complex of exchange traded funds