

If there was ever a time when a countertrend strategy was needed, it would be now. By countertrend, of course, I mean a tactic that gains while the stock market swoons. There are bear market funds aplenty, but those aren’t suitable as permanent portfolio allocations. There are bond funds of various stripes, too, which boast of low correlations to equities, but those are typically low volatility products whose gains are often swamped by equity losses.
Enter the 361 Capital Global Counter-Trend Fund (OTC: AGFQX), a managed futures strategy of a different sort. Employing a suite of systematic trading models, AGFQX takes long and short positions in equity index futures contracts—and equity futures only—in U.S., European and Asian markets. At times, the fund also goes to cash.
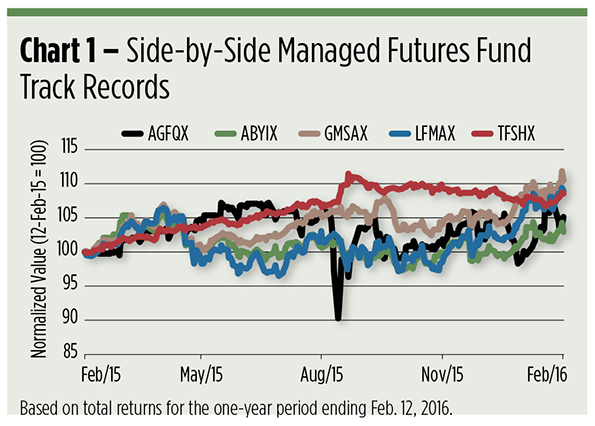
Over the past 12 months, the $18.9 million fund gained more than 5 percent while the S&P 500 lost nearly 9 percent. Countertrend indeed. It didn’t score its gains by simply shorting equity futures; that would be trend following, just in an opposite direction.
No, AGFQX thrives where there’s short-term up-and-down movement in its target equity indices. The fund aims to sell overbought contracts and buy futures at oversold levels to harvest market “noise,” or the frequency of directional changes. The greater the number of price swings, the more opportunities to buy on down days and sell on up ones. The fund’s managers, expecting that the size of trading losses and gains will be roughly equal over time, rely upon a high “hit ratio” (percentage of winning trades) to garner profits.
The fund runs into trouble when its target markets trend violently in one direction. That’s what happened late last summer when a market drop sent the fund skidding into a sharp drawdown (see Chart 1). The fund subsequently recovered, ultimately reaching new highs as the broad stock market found fresh lows.
More Strategies
The equity countertrend fund wasn’t the only managed futures strategy that found purchase this year. In fact, 96 percent of public managed futures funds—exchange traded and ’40 Act alike—have booked year-to-date gains. Some capitalized on the downtrend in the petroleum complex. Some picked up bullish gold positions. Others bought bond futures. For most, though, the gains haven’t been enough to overcome a year’s worth of setbacks. Of 34 portfolios extant (31 mutual funds and 3 ETFs), 21 are still under water on a 12-month basis.
A handful, AGFQX included, stand out because their year-to-date gains built on positive results earned over the preceding 12 months. They’re tallied in Table 1.
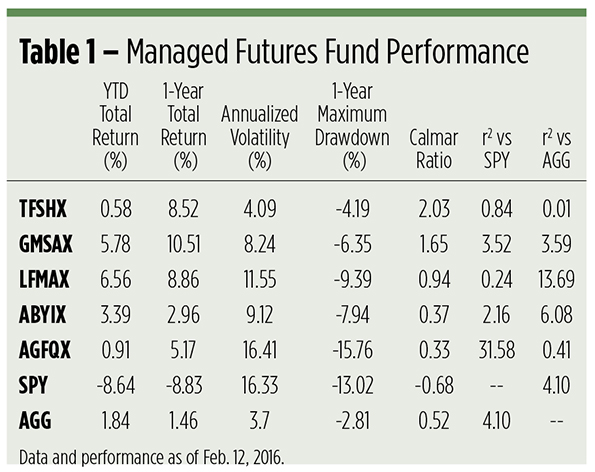
Like most managed futures strategies, these five mutual funds exhibit little correlation to the equity and bond markets. Notice the low r-squared (r2) coefficients versus the SPDR S&P 500 ETF (NYSE Arca: SPY) and the iShares Core US Aggregate Bond ETF (NYSE Arca: AGG). Think of these values as representing the degree (in percentage points) that movements in the index ETFs explain the managed futures products’ price variance. Most are quite low, though AGFQX, not surprisingly, shows a modest link to SPY because of the summer sell-off.
Notable, too, is volatility or, rather, the relative dearth of it. Maximum drawdowns for four of the five funds are fractions of SPY’s. These drawdowns represent the greatest peak-to-trough loss for each portfolio before a new high is attained.
Maximum drawdown is used to compute a managed futures or hedge fund’s risk-adjusted return. You can think of the Calmar ratio as the alternative investment world’s Sharpe ratio. The higher it is, the better an investment performed over a specified time period; the lower the ratio, the worse it behaved.
Under the Hood
We’ve already looked inside the 361 Capital countertrend portfolio, so let’s peek under the hoods of the others:
The $555.4 million LoCorr Managed Futures Strategy Fund (OTC: LFMAX) manages the futures side of its portfolio through an investment in a wholly-owned Cayman subsidiary. This controlled foreign corporation (“CFC”) is not subject to all of the investor protections of the ’40 Act, a fact that might be worrisome for some investors. At the very least, the arrangement makes the fund opaque. We can see fairly well how the fund’s collateral—the fixed-income portfolio used to meet margin requirements—is managed, but insight into the fund’s futures strategy is extremely limited. The fund engages a triad of trend-following commodity trading advisors (“CTAs”) on the futures side. At last look, the fund had a sizable short exposure in the energy sector. LFMAX is the most expensive product in the table with an annual expense ratio at 2.11 percent.
The Abbey Capital Futures Strategy Fund (OTC: ABYIX) is another multi-manager product that allocates, through its own CFC, to a roster of nine global investment advisors, each pursuing diverse trading strategies. Like the LoCorr fund, ABYIX actively manages its fixed-income collateral. And, like the LoCorr fund, Abbey’s $353 million futures fund most recently has been short the energy sector. Shorts in agricultural commodities also added to the fund’s gains. You’ll pay 1.99 percent a year to invest in ABYIX.
Trend momentum drives the Goldman Sachs Managed Futures Strategy Fund (OTC: GMSAX), which has profited through short positions in the commodities, currency and equity sectors as well as positions designed to capitalize on flattening in the fixed-income sector’s yield curve. GMSAX’s fund runners don’t use a CFC and manage the fund in-house, keeping the cost structure relatively low. Annual expenses run 1.51 percent currently for the $153.3 million portfolio.
With assets of just $16.9 million, the TFS Hedged Futures Fund (OTC: TFSHX) is the table’s smallest—and best-performing—portfolio. The fund relies upon a Cayman-based CFC to obtain its futures exposure, which is managed internally based on proprietary models. The TFS models don’t look for trends. Instead, they plumb the futures market term structure looking for value plays—buying underpriced contracts and selling those deemed rich, which, by combination, reduces exposure to the underlying asset. Ergo, the “hedge” in the fund’s title. Hedging comes at a price, namely a 1.80 percent expense ratio.
A Diverse Variety of Strategies
Managed futures—at least those funds showcased here—represent a diverse variety of strategies. That makes them difficult to classify as a true asset class. It behooves investors, and their advisors, to look closely at a fund’s return pattern to get a sense of its ability to mesh with existing allocations. Sometimes, a fund with a high return takes a backseat to one that is the better yin to an investor’s yang.
A look back over the past 12 months (see Table 2) illustrates the impact each of our five managed futures funds might have had on a classically allocated stock and bond portfolio. Here, a 20 percent exposure to managed futures is obtained with a carve-out from the equity allotment, transforming a 60/40 (by percentage, SPY and AGG, respectively) portfolio into a 40/40/20 mix.
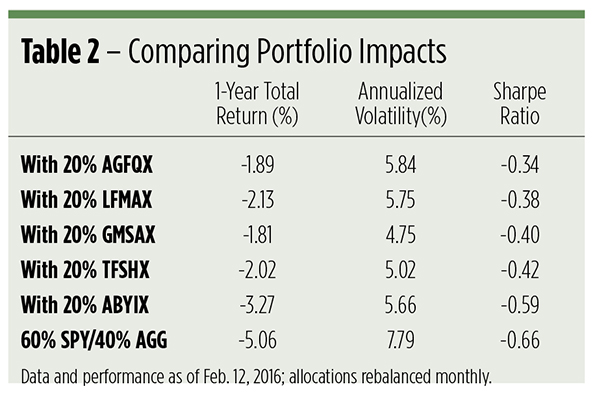
Adding any of the managed futures products to the basic portfolio improves returns. Though a 20 percent allocation isn’t enough to overcome the entirety of the equity market’s damage, it comes darn close. Portfolio volatility, too, is appreciably dampened.
Is it likely these funds will continue their (mostly) winning ways? Keep the words of Finnish Formula 1 racer Kimi Raikkonen in mind: “You always want to have a winning car, but there is no guarantee that it will be.”