If a picture’s worth a thousand words, I’m gonna save myself a lot of work today.
The jobs data are in: a beat, to be sure, for the headline number, but some worrisome digits for average wages and work hours.
Folks don’t seem to be sweating the small stuff, though. Investors and traders have been stepping up the risk ladder lately. BIG time. You can see this reflected in the pricing of some key exchange-traded funds (ETFs).
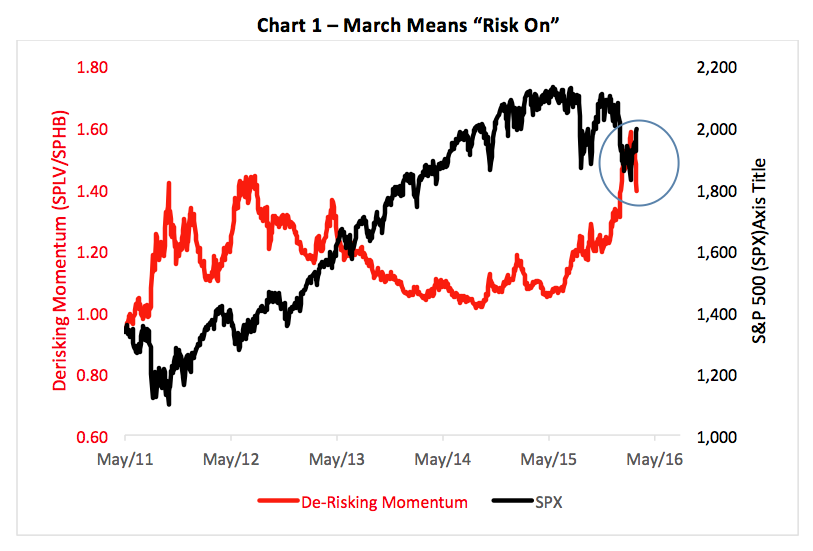
The PowerShares S&P 500 High Beta ETF (NYSE Arca: SPHB) strips out the most volatile components of the S&P bench while its stablemate, the PowerShares S&P 500 Low Volatility ETF (NYSE Arca: SPLV) does the opposite. Divide SPLV’s price by SPHB’s and, voilà, you have a quick indicator of the market’s aversion to risk.
By that measure, March has started out as a “risk-on” month. You can see this illustrated in Chart 1 below.
This month, folks seem more willing to buy the riskiest assets, a broadening trend confirmed by yet another ETF ratio.
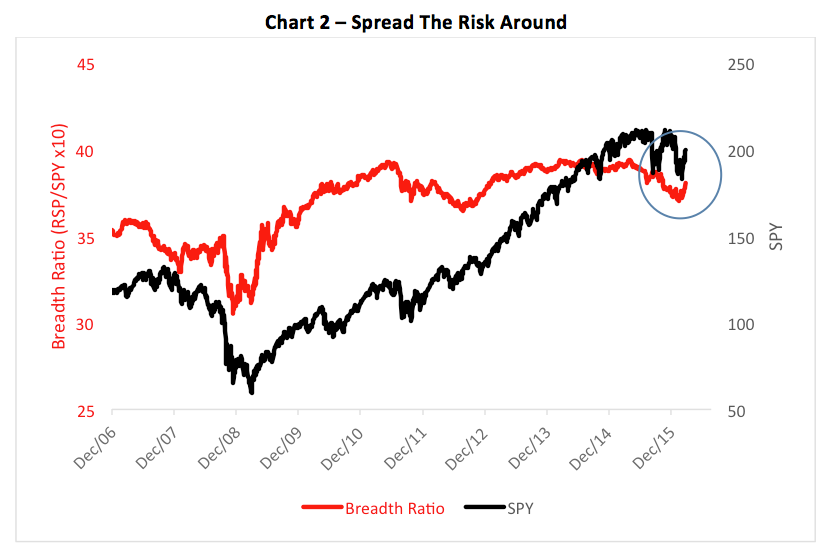
The Guggenheim S&P 500 Equal Weight ETF (NYSE Arca: RSP) rejiggers the blue chip index to give each issue the same heft, thereby amping up the influence of smaller-capitalized companies. The traditional capitalization-weighted benchmark, epitomized by the SPDR S&P 500 ETF (NYSE Arca: SPY), skews heavily toward its larger components. Roughly half of SPY’s price is determined by mega-cap ($200+ billion) stocks; these giant firms take up only 11 percent of RSP’s mass.
Index RSP’s price to SPY’s and you get a measure of market breadth. We’ve seen a rebound in market breadth since late January (see Chart 2).
Since February, we’ve also witnessed declines in the CBOE S&P 500 Volatility Index (CBOE: VIX) and the CBOE S&P 500 Implied Correlation Index (CBOE: KCJ). Pretty much everyone recalls the VIX as the “fear index,” but the correlation index is less well known.
KCJ measures, through option pricing, the expected correlation in the largest S&P 500 stocks. A low or falling implied correlation index indicates an expectation for diverse returns (read: a lack of correlation), representing a higher likelihood for alpha—negative or positive—to be obtained. A high or rising index points to higher correlation and an increased payoff potential for beta plays.
Chart 3 highlights that the most recent trajectory for both CBOE indices is downward, implying a lessening of fear and a more favorable environment for stock picking.

So, what’s all this mean?
A better-behaving equity market. And, presumably, an improved background for alpha hunting. Bottoming action in the S&P 500 implies a longer-term upside target around 2,343 which translates to the 234 level in the SPY fund. A lot can happen, though, on the way to these altitudes.
Good luck.
Brad Zigler is REP./WealthManagement's Alternative Investments Editor. Previously, he was the head of marketing, research and education for the Pacific Exchange's (now NYSE Arca) option market and the iShares complex of exchange traded funds.