Finding the best mutual funds is an increasingly difficult task in a world with so many to choose from.
You Cannot Trust Mutual Fund Labels
There are at least 950 different Large Cap Blend mutual funds and at least 6100 mutual funds across all styles. Do investors need that many choices? How different can these thousands of mutual funds be?
Even in the least popular style, Mid Cap Value, there are 195 separate mutual funds. These mutual funds vary widely in the number and type of holdings they have. For example, Artisan Mid Cap Value Fund (APHQX), Harbor Mid Cap Value Fund (HAMVX), and BMO Mid Cap Value Fund (MRVIX), three of my top rated mutual funds for this style, share none of their top five holdings.
While I am sure that Large Cap Value mutual funds hold many of the same big stocks such as Microsoft (MSFT), Target (TGT) and Exxon Mobil (XOM) investors need to know what else those mutual funds hold before they can say they have done their due diligence.
The same is true for the mutual funds in any style, as each offers a very different mix of good and bad stocks. Some styles have lots of good stocks and offer lots of good mutual funds. The opposite is true for other styles, while some styles lie in between with a fair mix of good and bad stocks. For example, Large Cap Growth, per my 3Q Style Rankings report, ranks fourth out of 12 styles when it comes to providing investors with quality mutual funds. Large Cap Blend ranks first once again, and Small Cap Value ranks last. Details on the Best & Worst mutual funds in each style are here.
The bottom line is: mutual fund labels do not tell you what kind of stocks you are getting in any given mutual fund.
Paralysis By Analysis
I firmly believe mutual funds for a given style should not all be that different. I think the large number of Large Cap Blend (or any other) style of mutual funds hurts investors more than it helps because too many options can be paralyzing. It is simply not possible for the majority of investors to properly assess the quality of so many mutual funds, even in a single style. Analyzing mutual funds, done with the proper diligence, is far more difficult than analyzing stocks because it means analyzing all the stocks within each mutual fund.
Any investor worth his salt knows that knowing the holdings of a mutual fund is critical to finding the best mutual fund.
Figure 1: Best Style Mutual Funds
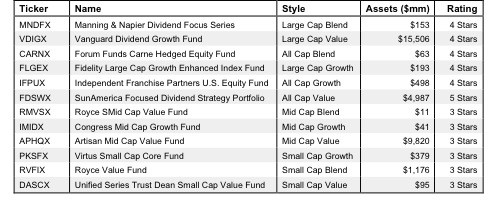 Sources: New Constructs, LLC and company filings
The Danger Within
Why do investors need to know the holdings of mutual funds before they buy? They need to know to be sure they do not buy a mutual fund that might blow up. Buying a mutual find without analyzing its holdings is like buying a stock without analyzing its business and finances. As Barron’s says, investors should know the Danger Within. No matter how cheap, if it holds bad stocks, the mutual fund’s performance will be bad.
PERFORMANCE OF MUTUAL FUND’S HOLDINGS = PERFORMANCE OF MUTUAL FUND
Finding the Style Mutual Funds with the Best Holdings
Figure 1 shows my top rated mutual fund for each style. Importantly, my ratings on mutual funds are based primarily on my stock ratings of their holdings. My firm covers over 3000 stocks and is known for the due diligence we do for each stock we cover. Accordingly, our coverage of mutual funds leverages the diligence we do on each stock by rating mutual funds based on the aggregated ratings of the stocks each fund holds.
Sun America Focused Dividend Strategy Portfolio (FDSWX) is the top-rated All Cap Value mutual fund and the overall top-rated fund of the 6100 style mutual funds I cover. Only the Large Cap Blend, Large Cap Value, Large Cap Growth, All Cap Growth, All Cap Blend and All Cap Value styles contain any Attractive (i.e. 4-star) or-better rated mutual funds while the best every other style can offer is a Neutral or 3-star fund.
Sometimes, you get what you pay for.
It is troubling to see one of the best style mutual funds, Northern Lights Iron Horse Fund (IRHIX) have just $22 million in assets. The largest mutual fund in Large Cap Value, Dodge & Cox Stock Fund (DODGX), has over $46 billion in assets, thought it only gets a Neutral (3-star) rating. DODGX’s expense ratio at 0.60% is lower than IRHIX’s at 2.08%, but as I state above, no matter how cheap a mutual fund, if it does not hold good stocks it will not perform well. Sometimes, you get what you pay for.
Another example of how you sometimes get what you pay for: Dimensional Investment U.S. Large Cap Value Portfolio (DFUVX). DFUVX has over $13 billion in assets despite getting a Dangerous (2-star) rating. Investors seem to be attracted to its low expense ratio of 0.18% with less regard for the quality of its holdings. Meanwhile, the top-rated All Cap Value Fund, Sun America Focused Dividend Strategy (FDSWX), has a 5-star rating but less than half of DFUVX’s assets.
I cannot help but wonder if investors would leave DFUVX if they knew that it has such a poor portfolio of stocks. It is cheaper than FDSWX, but as previously stated, low fees cannot growth wealth, only good stocks can.
Sometimes, you DON’T get what you pay for.
This is especially true for mutual funds, as their costs can be harder to discern than those of ETFs. While the only significant costs for ETFs are expense ratios, investors have to factor in front-end load and transaction costs to determine the true cost of a mutual fund.
Take Lord Abbett Affiliated Fund (LAFPX) for example. LAFPX has almost $7 billion in assets with total annual costs of 1.08% and a Dangerous portfolio management rating, giving it a Dangerous rating overall. Compare this to another Large Cap Value fund, Advisors’ Inner Circle LSV Conservative Core Equity Fund (LSVPX), with an Attractive portfolio management rating and costs of 0.42%. One would think this fund would attract more investors than LAFPX, but LSVPX has just $13 million in assets. Sometimes you do not get what you pay for.
Investors should aim to avoid high fees, especially when they are paired with inferior management. There are plenty of funds that offer quality holdings for low prices: Vanguard Dividend Growth Fund (VDIGX) has both an Attractive portfolio management rating and low annual costs of 0.34%.
Along with quality holdings and low fees, liquidity is an important factor in picking mutual funds. I recommend investors only buy mutual funds with more than $100 million in assets. You can find more liquid alternatives for the other funds on my free ETF and mutual fund screener.
Covering All The Bases, Including Costs
My mutual fund rating also takes into account the total annual costs, which represents the all-in cost of being in the fund. While, my ratings weight the quality of holdings more heavily than these costs, those funds that do charge abnormally high funds to investors are penalized.
Top Stocks Make Up Top Mutual Funds
One of my favorite holdings in VDIGX is Medtronic Inc. (MDT), which gets my Attractive (4-star) rating. MDT has an impressive track record of growth over long periods of time. Since 1998, it has grown after-tax profit (NOPAT) by 14% compounded annually. On top of this, MDT has a return on invested capital (ROIC) of 13%. Despite this track record of growth, its valuation of ~$55/share gives it a price to economic book value ratio of only 0.9. This valuation implies that the company’s profits will experience a permanent 10% decline. MDT’s impressive track record of profitability and effective use of capital suggest market expectations are too low. There is plenty of upside to this undervalued stock.
FDSWX has a Very Attractive portfolio rating and is the top-rated mutual fund in the All Cap Value style in Figure 1, as well as my top-rated mutual fund overall: it allocates three quarters of its portfolio to Attractive-or-better rated stocks. Altria Group (MO) is one of FDSWX’s top holdings and earns my Very Attractive rating. MO has grown NOPAT for each of the past 4 years, and has earned positive economic earnings every year since 1998. MO’s return on invested capital (ROIC) of 18% also puts it in the top quintile of all companies I cover.
With such strong indicators of growth, it is surprising that MO is trading at only ~$36/share, a 20% discount to its no-growth value (i.e. economic book value) per share is $43.39. Thus, with a price to economic book value ratio of 0.8, the current market valuation is predicting a permanent 20% decline in Altria’s profitability. Altria’s track record and its recent diversification into the wine and spirits business bode well for the company’s future. These low market expectations are good news for holders of MO, which includes, indirectly, investors in FDSWX.
André Rouillard and contributed to this report.
Disclosure: David Trainer and André Rouillard receive no compensation to write about any specific stock, sector, or theme.