Picking from the multitude of sector ETFs is a daunting task. In any given sector there may be as many as 40 different ETFs, and there are at least 163 ETFs across all sectors.
Why are there so many ETFs? The answer is: because ETF providers are making lots of money selling them. The number of ETFs has little to do with serving investors’ best interests. Below are three red flags investors can use to avoid the worst ETFs:
- Inadequate liquidity
- High fees
- Poor quality holdings
I address these red flags in order of difficulty. Advice on How to Find the Best Sector ETFs is here. Details on the Best & Worst ETFs in each sector are here.
How To Avoid ETFs with Inadequate Liquidity
This is the easiest issue to avoid and my advice is simple. Avoid all ETFs with less than $100 million in assets. Low levels of liquidity can lead to a discrepancy between the price of the ETF and the underlying value of the securities it holds. This makes it difficult to predict future performance.
How To Avoid High Fees
ETFs should be cheap, but not all of them are. The first step here is to know what is cheap and expensive.
To ensure you are paying at or below average fees, invest only in ETFs with an expense ratio below 0.55%, which is the average expense ratio of the 163 US equity ETFs I cover. Weighting the expense ratios by assets under management, the average expense ratio is lower at 0.31%. A lower weighted average is a good sign that investors are putting money in the cheaper ETFs.
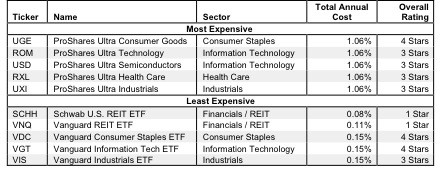
Figure 1 shows the most and least expensive sector ETFs in the US equity universe based on total annual costs. ProShares provides all five of the most expensive ETFs while Vanguard Group ETFs are among the cheapest.
Figure 1: Most and Least Expensive ETFs
 Source: New Constructs, LLC.
Proshares Ultra Consumer Goods (UGE) and ProShares Ultra Technology (ROM) are the two most expensive US equity ETFs I cover. Schwab U.S. REIT (SCHH) and Vanguard REIT (VNQ) are the least expensive. Ironically, RXL and UGE are also the best-rated ETFs in Figure 1 while the cheapest ETFs receive my worst 1-Star or Very Dangerous Rating. RXL and UGE earn good ratings because the quality of their holdings is strong despite their higher costs.
However, investors need not pay high fees for good holdings. Consumer Staples Select Sector SPDR (XLP) is my highest rated ETF and one of only two to get a Very Attractive (5-star) rating, yet it has a low total annual cost of 0.20%. Vanguard Consumer Staples ETF (VDC), the third cheapest ETF available, is also my third highest rated ETF. Investors do not need to pay high fees for funds with good stocks.
On the other hand, SCHH and VNQ hold poor stocks. And no matter how cheap an ETF, if it holds bad stocks, its performance will be bad.
This result highlights why investors should not choose ETFs based only on price. The quality of holdings matters more than price.
How To Avoid ETFs with the Worst Holdings
This step is by far the hardest, but it is also the most important because an ETF’s performance is determined more by its holdings than its costs. Figure 2 shows the ETFs within each sector with the worst holdings or portfolio management ratings. The sectors are listed in descending order by overall rating as detailed in my 1Q Sector Ratings report.
Figure 2: Sector ETFs With the Worst Holdings
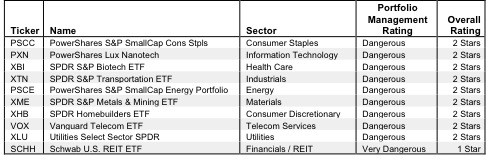 Source: New Constructs, LLC.
My overall ratings on ETFs are based primarily on my stock ratings of their holdings. My firm covers over 3000 stocks and is known for the due diligence done on each stock we cover.
SPDR ETFs appear more often than any other provider in Figure 2, which means they offer the most ETFs with the worst holdings. SPDR S&P Biotech ETF (XBI) has the worst holdings of all health care ETFs. SPDR S&P Transportation ETF (XTN), SPDR S&P Metals & Mining ETF (XME), SPDR Homebuilders ETF (XHB), and Utilities Select Sector SPDR (XLU) have the worst holdings of all ETFs in their respective sectors. Not all SPDR ETFs are bad, however. As previously mentioned, Consumer Staples Select Sector SPDR (XLP) gets the highest rating of all sector ETFs.
Note that no ETFs with a dangerous portfolio management rating earn an overall rating better than two stars. These scores are consistent with my belief that the quality of an ETF is more about its holdings than its costs. If the ETF’s holdings are dangerous, then the overall rating cannot be better than dangerous because one cannot expect the performance of the ETF to be any better than the performance of its holdings.
Figure 2 reveals that the cheapest ETF, SCHH, gets my worst rating because its holdings get my Very Dangerous rating. Similarly, Utilities Select Sector SPDR (XLU), also one of the cheapest ETFs, gets a Dangerous portfolio management rating and, therefore, cannot earn anything better than a 2-star or Dangerous overall rating. Again, the ETF’s overall rating cannot be any better than the rating of its holdings.
Find the ETFs with the worst overall ratings on my ETF screener. More analysis of the Best Sector ETFs is here.
The Danger Within
Buying an ETF without analyzing its holdings is like buying a stock without analyzing its business and finances. As Barron’s says, investors should know the Danger Within. Put another way, research on ETF holdings is necessary due diligence because an ETF’s performance is only as good as its holdings’ performance.
PERFORMANCE OF ETF’s HOLDINGs = PERFORMANCE OF ETF
Best & Worst Stocks In these ETFs
Prologis Inc. (PLD) is one of worst stocks I cover. It is one of the top five holdings of SCHH and earns my Very Dangerous rating. PLD has misleading earnings – its economic earnings are negative and declining while its reports accounting earnings are increasing. During the 14 years in my model, the company has never generated positive economic earnings. Not only is PLD not profitable, it is also overvalued. To justify its current stock price of ~$39.12, the company must increase after tax profits (NOPAT) by 24% compounded annually for 11 years. That is an awful high growth expectation for any company. Given PLD’s lack of profitability historically, betting on such impressive growth is a major risk.
The Altria Group (MO) is one of favorite holdings in VDC, one of two low-cost ETFs in Figure 1 to get my 4-star rating. This stock gets my Very Attractive rating. MO has a return on invested capital (ROIC) of 18%, which places it in the top quintile of all companies. Even though the cigarette industry as a whole is clearly on a downward trend, MO has grown NOPAT by 10% compounded annually over the past four years. It has also managed to diversify its business in the past few years, acquiring a 27% stake in SAB Miller. While such profitability usually translates to a high valuation, MO’s share price (~$34.26) gives it aprice to economic book value ratio of 0.8. This valuation implies a permanent 20% decline in profitability. With such low risk built into the stock price, investors get the opportunity for high returns with very little risk. The fact that MO is one of VDC’s top five holdings helps explain why VDC is one of the few ETFs to get my Attractive rating.
Sam McBride contributed to this article
Disclosure: David Trainer and Sam McBride receive no compensation to write about any specific stock, sector, or theme.