Current solar activity has reached a five-year peak, according to NASA, although this is one of the smallest sunspot cycles in the last 100 years. What does that mean for your clients’ investments?
A lot, says Robert Novy-Marx, associate professor of finance at the University of Rochester. After looking at research on well-known economic predictors such as short-term interest rates, credit spreads, the term structure slope, stock volatility and the aggregate dividend yield, Novy-Marx was inspired to study more unconventional predictors. Planetary movements, sunspots, and the El Nino phenomenon, for instance, have significant power in predicting stock market performance, he argues in a paper in the May issue of the Journal of Financial Economics. And the results, he says, are striking:
High levels of solar activity seem to inhibit investors’ capacity to process information, reducing the rate at which news gets incorporated into prices. This increases the profitability of strategies that exploit slow adjustments of prices to fundamentals. Strategies that trade on prior year’s stock performance and earnings surprises consequently have returns that are significantly positively correlated with the number of sunspots observed in the previous month.
The total number of sunspots observed over the preceding solar cycle (125-months) also has significant power predicting anomaly performance. This number, which measures the amplitude of the last solar cycle, as opposed to where one is in the current cycle, predicts the performance of strategies based on market capitalization, Ohlson’s O-score, and Heston and Sadka’s (2008) seasonality in stocks’ performances. Unusually intense solar cycles seem to predict poor future performance for small caps, but strong future performance for strategies that bet on stocks that performed well in the same calendar month in preceding years, or against high default probability stocks.
As I said, we’re currently experiencing a high level of solar activity, but lower than the previous cycle’s peak. If you go by Novy-Marx’s methodology, investors tend to underreact to information out there, and are slow to account for stock fundamentals.
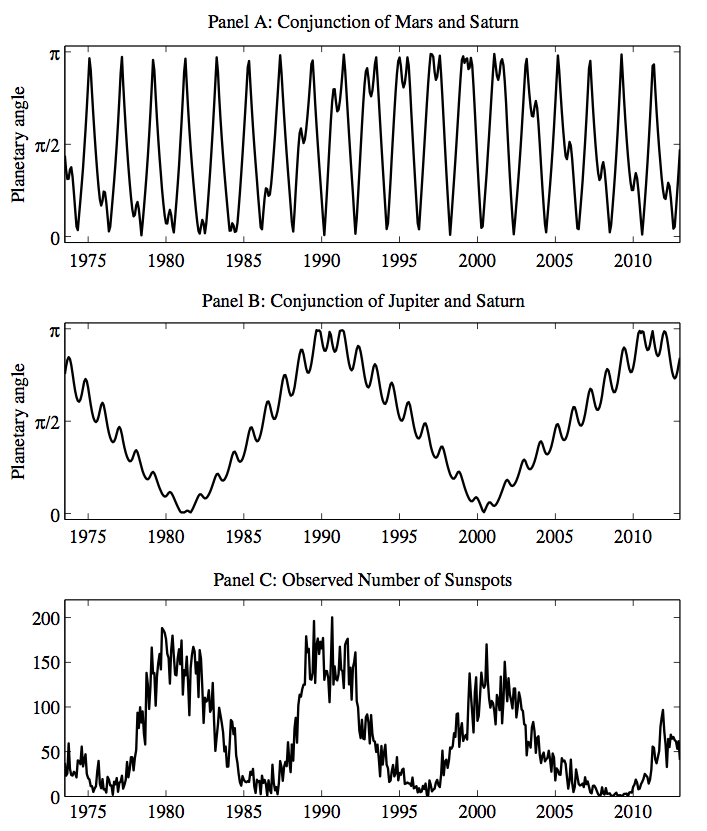
Planetary activity may also predict market performance:
The market performs significantly better when Mars and Saturn are opposed. Times when Mars and Saturn are struggling for dominance and their energies are polarized appear to be particularly propitious times to invest in the market. In contrast, high quality firms’ outperformance of lower quality firms appears to occur primarily when Mars and Saturns’ energies are strongly blended. Many earnings related anomalies, including those based on return-on-assets, earnings-to-price, idiosyncratic volatility, and the distress mea- sures of Ohlson (1980) and Campbell et. al. (2008), perform better when these planets are in conjunction, appearing in close proximity to an earth observer.
The polarization of Jupiter and Saturn, he says, are related to lagging growth and “should perhaps be taken as a sign to delay plans for rapid expansion.”
What unconventional market predictors do you use?