The Materials sector ranks seventh out of the ten sectors as detailed in my Sector Rankings for ETFs and Mutual Funds report. It gets my Dangerous rating, which is based on aggregation of ratings of 10 ETFs and 15 mutual funds in the Materials sector as of October 10, 2013. Prior reports on the best & worst ETFs and mutual funds in every sector are here.
Figure 1 ranks from best to worst the nine Materials ETFs that meet our liquidity minimums and Figure 2 shows the five best and worst-rated Materials mutual funds. Not all Materials sector ETFs and mutual funds are created the same. The number of holdings varies widely (from 27 to 141). This variation creates drastically different investment implications and, therefore, ratings. The best ETFs and mutual funds allocate more value to Attractive-or-better-rated stocks than the worst ETFs and mutual funds, which allocate too much value to Neutral-or-worse-rated stocks.
To identify the best and avoid the worst ETFs and mutual funds within the Materials sector, investors need a predictive rating based on (1) stocks ratings of the holdings and (2) the all-in expenses of each ETF and mutual fund. Investors need not rely on backward-looking ratings. My fund rating methodology is detailedhere.
Investors should not buy any Materials ETFs or mutual funds because none get an Attractive-or-better rating. If you must have exposure to this sector, you should buy a basket of Attractive-or-better rated stocks and avoid paying undeserved fund fees. Active management has a long history of not paying off. Here’s the list of our top-rated Materials stocks.
Get my ratings on all ETFs and mutual funds in this sector on my free mutual fund and ETF screener.
Figure 1: ETFs with the Best & Worst Ratings – Top 5
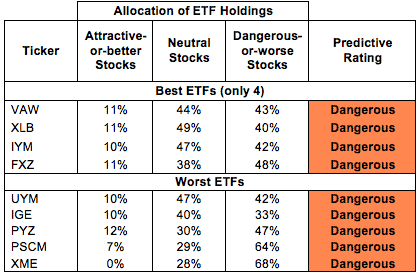 * Best ETFs exclude ETFs with TNAs less than $100 million for inadequate liquidity.
Sources: New Constructs, LLC and company filings
Guggenheim S&P Equal Weight Materials ETF (RTM) is excluded from Figure 1 because its total net assets (TNA) are below $100 million and do not meet our liquidity minimums.
Figure 2: Mutual Funds with the Best & Worst Ratings – Top 5
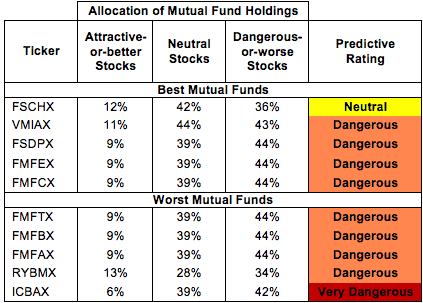 * Best mutual funds exclude funds with TNAs less than $100 million for inadequate liquidity.
Sources: New Constructs, LLC and company filings
Rydex Series Funds: Basic Materials Fund (RYBIX) is excluded from Figure 2 because its total net assets (TNA) are below $100 million and do not meet our liquidity minimums.
Vanguard Materials ETF (VAW) is my top-rated Materials ETF and Fidelity Select Portfolios: Chemicals Portfolio (FSCHX) is my top-rated Materials mutual fund. VAW earns my Dangerous rating and FSCHX earns my Neutral rating.
SPDR S&P Metals & Mining ETF (XME) is my worst-rated Materials ETF and ICON Materials Fund (ICBAX) is my worst-rated Materials mutual fund. XME earns my Dangerous rating and ICBAX earns my Very Dangerous rating.
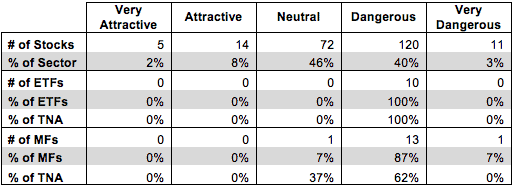
Figure 3 shows that 19 out of the 223 stocks (over 10% of the market value) in Materials ETFs and mutual funds get an Attractive-or-better rating. However, no Materials ETFs or mutual funds earn an Attractive rating.
The takeaways are: mutual fund managers allocate too much capital to low-quality stocks and Materials ETFs hold poor quality stocks.
Figure 3: Materials Sector Landscape For ETFs, Mutual Funds & Stocks
 Sources: New Constructs, LLC and company filings
As detailed in “Cheap Funds Dupe Investors”, the fund industry offers many cheap funds but very few funds with high-quality stocks, or with what I call good portfolio management.
Investors need to tread carefully when considering Materials ETFs and mutual funds, as only one mutual fund and no ETFs manage to even earn a Neutral rating. 10 out of 10 ETFs and 14 out of 15 mutual funds in the Materials sector earn a Dangerous-or-worse rating. Investors should focus on individual stocks instead,
Southern Copper Corp (SCCO) is one of my favorite stocks held by Materials ETFs and mutual funds and earns my Very Attractive rating. SCCO earns a top-quintile return on invested capital (ROIC) of 37%. SCCO’s leading competitor, Freeport McMoRan (FCX) only earns a 10% ROIC. Additionally, SCCO’s balance sheet looks very good. The company has $2.5 billion in excess cash. It is also one of only 50 companies in our database to have an overfunded pension. The large cash position and lack of pension liabilities means SCCO can return cash to shareholders or invest in projects to grow revenue in the future without having to borrow money.
Despite these long-term positives, the market has focused on short-term data points when it comes to SCCO. The stock is down 28% so far this year due to quarterly earnings disappointments. From the point of view of a long-term investor, this price decline makes now a good time to buy. At its current valuation of ~$27/share, SCCO has a price to economic book value ratio of 1, which implies zero growth in after-tax profit (NOPAT) for the remainder of its corporate existence. Unless you think demand for copper will remain at current levels forever, such a pessimistic expectations seem unwarranted.
International Paper Company (IP) is one of my least favorite stocks held by Materials ETFs and mutual funds and earns my Dangerous rating. IP looks like a company in a long-term decline. The company had lower revenues and NOPAT in 2012 than it did in 2000. Its ROIC is stuck at a bottom-quintile 4%, well below its weighted average cost of capital (WACC) of 8%. To make matters worse, the stock is richly valued at ~$44/share. This valuation implies that IP will grow its NOPAT by 10% compounded annually for 17 years. Such a high valuation prices out any potential upside. IP looks like a high risk/low reward proposition.
161 stocks of the 3000+ I cover are classified as Materials stocks, but due to style drift, Materials ETFs and mutual funds hold 223 stocks.
Figures 4 and 5 show the rating landscape of all Materials ETFs and mutual funds.
My Sector Rankings for ETFs and Mutual Funds report ranks all sectors and highlights those that offer the best investments.
Figure 4: Separating the Best ETFs From the Worst ETFs
 Sources: New Constructs, LLC and company filings
Figure 5: Separating the Best Mutual Funds From the Worst Mutual Funds
 Sources: New Constructs, LLC and company filings
Review my full list of ratings and rankings along with reports on all 10 ETFs and 15 mutual funds in the Materials sector.
Sam McBride contributed to this report.
Disclosure: David Trainer owns SCCO. David Trainer and Sam McBride receive no compensation to write about any specific stock, sector or theme.