The Financials sector ranks last out of the ten sectors as detailed in my Sector Rankings for ETFs and Mutual Funds report. It gets my Dangerous rating, which is based on aggregation of ratings of 43 ETFs and 232 mutual funds in the Financials sector as of April 24, 2013. Prior reports on the best & worst ETFs and mutual funds in every sector and style are here.
Figures 1 and 2 show the five best and worst-rated ETFs and mutual funds in the sector. Not all Financial sector ETFs and mutual funds are created the same. The number of holdings varies widely (from 21 to 523), which creates drastically different investment implications and ratings. The best ETFs and mutual funds allocate more value to Attractive-or-better-rated stocks than the worst ETFs and mutual funds, which allocate too much value to Neutral-or-worse-rated stocks.
To identify the best and avoid the worst ETFs and mutual funds within the Financials sector, investors need a predictive rating based on (1) stocks ratings of the holdings and (2) the all-in expenses of each ETF and mutual fund. Investors need not rely on backward-looking ratings.
My fund rating methodology is detailed here.
Investors should not buy any Financials ETFs or mutual funds because none get an Attractive-or-better rating. If you must have exposure to this sector, you should buy a basket of Attractive-or-better rated stocks and avoid paying undeserved fund fees. Active management has a long history of not paying off.
Get my ratings on all ETFs and mutual funds in this sector on my free mutual fund and ETF screener.
Figure 1: ETFs with the Best & Worst Ratings – Top 5
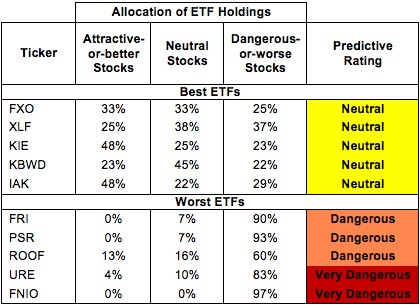
* Best ETFs exclude ETFs with TNAs less than $100 million for inadequate liquidity.
Sources: New Constructs, LLC and company filings
KBWP, PFI, KBWC, and KCE are excluded from Figure 1 because their total net assets (TNA) are below $100 million and do not meet our liquidity standards.
Figure 2: Mutual Funds with the Best & Worst Ratings – Top 5
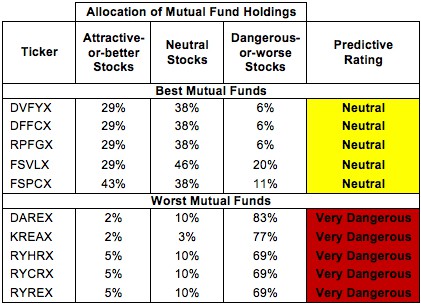
* Best mutual funds exclude funds with TNAs less than $100 million for inadequate liquidity.
Sources: New Constructs, LLC and company filings
PowerShares KBW Property & Casualty Insurance Portfolio (KBWP) is my top-rated Financials ETF and Davis Financial Fund (DVFYX) is my top-rated Financials mutual fund. Both earn my Neutral rating.
iShares FTSE NAREIT Industrial/Office Capped Index Fund (FNIO) is my worst-rated Financials ETF and Rydex Series Funds: Real Estate Fund (RYREX) is my worst-rated Financials mutual fund. Both earn my Very Dangerous rating.
Figure 3 shows that 102 out of the 575 stocks in Financials ETFs and mutual funds get an Attractive-or-better rating. It is troubling, then, that no ETFs or mutual funds in the Financials sector allocate enough value to Attractive-or-better rated stocks to earn an Attractive rating. Not only that, but 26 out of the 43 ETFs and 220 out of the 232 mutual funds in the Financials sector earn Dangerous-or-worse ratings.
Mutual fund managers and ETF providers seem more focused on the bad stocks than the good ones. Any fees paid for these funds are more than the managers or the providers deserve.
Figure 3: Financials Sector Landscape For ETFs, Mutual Funds & Stocks
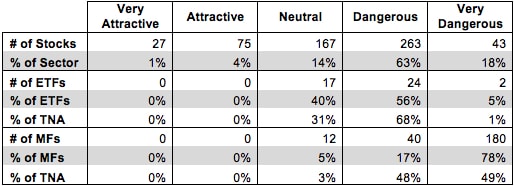
Sources: New Constructs, LLC and company filings
As detailed in “Cheap Funds Dupe Investors”, the fund industry offers many cheap funds but very few funds with high-quality stocks, or with what I call good portfolio management.
Investors should avoid Financials ETFs and mutual funds, as none earn an Attractive-or-better rating. Focus on individual stocks instead.
Discover Financial Services (DFS) is one of my favorite stocks held by Financials ETFs and mutual funds and earns my Very Attractive rating. DFS boasts a top-quintile return on invested capital (ROIC) of 17% and grew after tax profit (NOPAT) by an impressive 89% in 2012. This growth comes not just from the rebound in consumer spending. DFS has increased the volume of payment on their cards via partnering with PayPal and Google Wallet to expand the ways in which one can use Discover cards. These partnerships are a very high-margin source of income and present opportunity to tap into large markets. Accordingly, DFS appears to be poised for further profit growth, but the market seems to disagree. At its current share price of ~$44.33, DFS has a price to economic book value ratio of 0.96, which means the market is actually predicting a permanent 4% decrease in NOPAT for DFS. Strong performance combined with low expectations makes DFS a low risk/high reward stock for investors.
The Charles Schwab Corp (SCHW) is one of my least favorite stocks held by Financials ETFs and mutual funds and earns my Very Dangerous rating. As the market recovers, one would expect SCHW to see its profits rise. Instead, SCHW’s NOPAT declined slightly in 2012, and its ROIC declined by 1.2% down to a 4th quintile 7.2%. Increased competition from other platforms like TD Ameritrade (AMTD), TradeStation, Fidelity and a host of others is keeping SCHW’s bottom line from growing in stride with the stock market’s performance. Increasingly, SCHW and its competitors are in a commoditized business as trading tools have become accessible for cheap from multiple providers. In addition, it is increasingly difficult for the online investing firms to differentiate their services meaningfully enough to derive any pricing power. Providing access to markets and technical trading tools is not enough anymore. Despite this recent stagnation in growth and their strategic challenges, the market has high expectations for SCHW. To justify its current valuation of ~$16.59/share, SCHW would have to grow NOPAT by 7% compounded annually for 15 years.
Investors should always be wary of falling into the theme-investing trap. Just because the market is going up, investors should not assume, for reasons above, that Schwab’s profits will rise. In some ways, the online investing companies are like Apple (AAPL) and are living off past successes. They need to come up with the next big thing to keep pricing power and growth going. Otherwise, they will die the slow death of a commoditized business.
592 stocks of the 3000+ I cover are classified as Financials stocks, but due to style drift, Financials ETFs and mutual funds hold 575 stocks.
Figures 4 and 5 show the rating landscape of all Financials ETFs and mutual funds.
My Sector Rankings for ETFs and Mutual Funds report ranks all sectors and highlights those that offer the best investments.
Figure 4: Separating the Best ETFs From the Worst ETFs
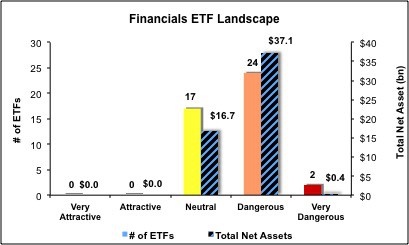
Sources: New Constructs, LLC and company filings
Figure 5: Separating the Best Mutual Funds From the Worst Mutual Funds
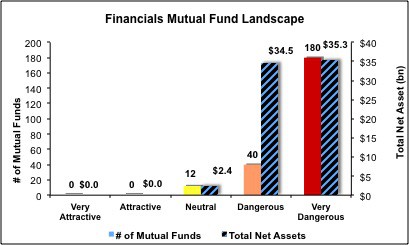
Sources: New Constructs, LLC and company filings
Review my full list of ratings and rankings along with reports on all 43 ETFs and 232 mutual funds in the Financials sector.
Sam McBride contributed to this report
Disclosure: David Trainer and Sam McBride receive no compensation to write about any specific stock, sector or theme.