The Small Cap Value style ranks last out of the twelve fund styles as detailed in my Style Rankings for ETFs and Mutual Funds report. It gets my Dangerous rating, which is based on aggregation of ratings of 15 ETFs and 236 mutual funds in the Small Cap Value style as of October 24, 2013. Prior reports on the best & worst ETFs and mutual funds in every sector and style are here.
Figures 1 and 2 show the five best and worst-rated ETFs and mutual funds in the style. Not all Small Cap Value style ETFs and mutual funds are created the same. The number of holdings varies widely (from 19 to 1626). This variation creates drastically different investment implications and, therefore, ratings. The best ETFs and mutual funds allocate more value to Attractive-or-better-rated stocks than the worst, which allocate too much value to Neutral-or-worse-rated stocks.
To identify the best and avoid the worst ETFs and mutual funds within the Small Cap Value style, investors need a predictive rating based on (1) stocks ratings of the holdings and (2) the all-in expensesof each ETF and mutual fund. Investors need not rely on backward-looking ratings. My fund rating methodology is detailed here.
Investors should not buy any Small Cap Value ETFs or mutual funds because none get an Attractive-or-better rating. If you must have exposure to this style, you should buy a basket of Attractive-or-better rated stocks and avoid paying undeserved fund fees. Active management has a long history of not paying off.Here’s the list of our top-rated stocks.
Get my ratings on all ETFs and mutual funds in this style by searching for Small Cap Value on my freemutual fund and ETF screener.
Figure 1: ETFs with the Best & Worst Ratings – Top 5
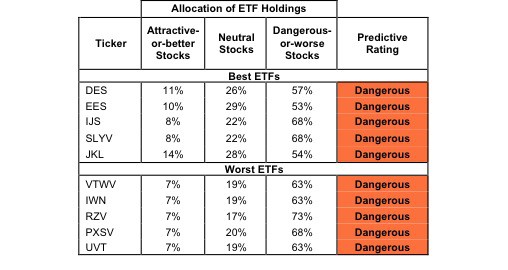 * Best ETFs exclude ETFs with TNAs less than $100 million for inadequate liquidity.
Sources: New Constructs, LLC and company filings
iShares Enhanced U.S. Small-Cap ETF (IESM), First Trust Small Cap Value AlphaDEX Fund (FYT) and Vanguard S&P Small-Cap 600 Value ETF (VIOV) are excluded from Figure 1 because their total net assets (TNA) are below $100 million and do not meet our liquidity minimums.
Figure 2: Mutual Funds with the Best & Worst Ratings – Top 5
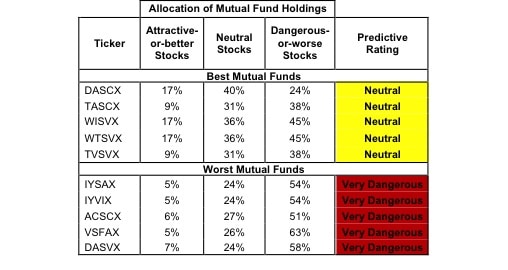 * Best mutual funds exclude funds with TNAs less than $100 million for inadequate liquidity.
Sources: New Constructs, LLC and company filings
Investment Managers Series Trust: Bernzott US Small Cap Value Fund (BSCVX), Advisors’ Inner Circle Fund: LSV Small Cap Value Fund (LSVQX) and ICON Funds: ICON Opportunities Fund (ICONX) are excluded from Figure 2 because their total net assets (TNA) are below $100 million and do not meet our liquidity minimums.
WisdomTree SmallCap Dividend Fund (DES) is my top-rated Small Cap Value ETF and Unified Series Trust: Dean Small Cap Value Fund (DASCX) is my top-rated Small Cap Value mutual fund. DES earns my Dangerous rating and DASCX earns my Neutral rating.
ProShares Ultra Russell2000 Value (UVT) is my worst-rated Small Cap Value ETF and Dunham Funds: Dunham Small Cap Value Fund (DASVX) is my worst-rated Small Cap Value mutual fund. UVT earns my Dangerous rating and DASVX earns my Very Dangerous rating.
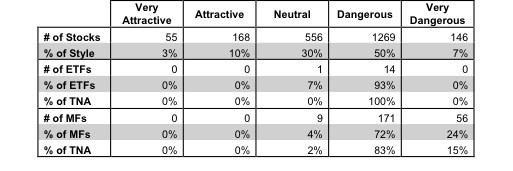
Figure 3 shows that 223 out of the 2194 stocks (over 13% of the market value) in Small Cap Value ETFs and mutual funds get an Attractive-or-better rating. However, zero out of 15 Small Cap Value ETFs and zero out of 236 Small Cap Value mutual funds get an Attractive-or-better rating.
The takeaways are: mutual fund managers allocate too much capital to low-quality stocks and Small Cap Value ETFs hold poor quality stocks.
Figure 3: Small Cap Value Style Landscape For ETFs, Mutual Funds & Stocks
 Sources: New Constructs, LLC and company filings
As detailed in “Low-Cost Funds Dupe Investors”, the fund industry offers many cheap funds but very few funds with high-quality stocks, or with what I call good portfolio management.
Investors need to tread carefully when considering Small Cap Value ETFs and mutual funds, as 100% of ETFs and 98% of mutual funds in the style earn a Dangerous-or-worse rating. No ETFs or mutual funds in the Small Cap Value style allocate enough value to Attractive-or-better-rated stocks to earn an Attractive rating. Investors would be better off to focus on individual stocks instead.
C&F Financial Corp (CFFI) is one of my favorite stocks held by Small Cap Value ETFs and mutual funds and earns my Attractive rating. C&F Financial has grown after-tax profits (NOPAT) by 21% compounded annually over the last five years and has generated positive and increasing economic earnings over the same time period. The company currently earns a return on invested capital (ROIC) of 12%, an increase from 7% in 2008. This small bank’s strong growth has drawn the attention of investors, as CFFI’s stock price has increased by 43% year-to-date. Even with the jump in price, the stock is still undervalued. CFFI currently trades at ~$56/share, which gives it a price-to-economic book value (PEBV) of only 0.5. At this valuation, the market expects the company’s NOPAT to permanently decline by 50%. Given the company’s history of consistent growth, these expectations seem very low. Despite the increase in price, there is still plenty of value left in CFFI for investors.
CNO Financial Group, Inc. (CNO) is one of my least favorite stocks held by Small Cap Value ETFs and mutual funds and earns my Dangerous rating. CNO Financial Group’s after-tax profits (NOPAT) have declined by 7% compounded annually over the last eight years. The company only earns a return on invested capital (ROIC) of only 4%, which puts it in the lowest quintile out of all of the companies that I cover. Worse yet, CNO has generated negative economic earnings since 2004. Even with these profit declines, the stock is very expensive. To justify its current price of ~$15/share, the company must grow NOPAT by 13% compounded annually over the next 16 years. For a company with declining profits and negative economic earnings, these expectations are very high. Actual profit declines combined with high profit growth expectations make CNO a stock to avoid.
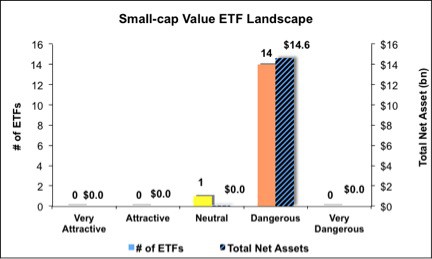
Figures 4 and 5 show the rating landscape of all Small Cap Value ETFs and mutual funds.
My Style Rankings for ETFs and Mutual Funds report ranks all styles and highlights those that offer the best investments.
Figure 4: Separating the Best ETFs From the Worst Funds
Sources: New Constructs, LLC and company filings
Figure 5: Separating the Best Mutual Funds From the Worst Fund
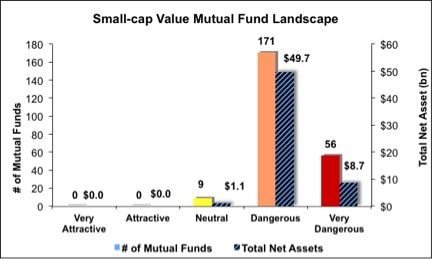
Sources: New Constructs, LLC and company filings
Review my full list of ratings and rankings along with reports on all 15 ETFs and 236 mutual funds in the Small Cap Value style.
Jared Melnyk contributed to this report.
Disclosure: David Trainer and Jared Melnyk receive no compensation to write about any specific stock, sector, style or theme.