The Small-cap Value style ranks twelfth out of the twelve fund styles as detailed in my Style Rankings for ETFs and Mutual Funds report. It gets my Dangerous rating, which is based on aggregation of ratings of 14 ETFs and 276 mutual funds in the Small-cap Value style as of May 3, 2013. Prior reports on the best & worst ETFs and mutual funds in every sector and style are here.
Figures 1 and 2 show the five best and worst-rated ETFs and mutual funds in the style. Not all Small-cap Value style ETFs and mutual funds are created the same. The number of holdings varies widely (from 15 to 1,639), which creates drastically different investment implications and ratings. The best ETFs and mutual funds allocate more value to Attractive-or-better-rated stocks than the worst, which allocate too much value to Neutral-or-worse-rated stocks.
To identify the best and avoid the worst ETFs and mutual funds within the Small-cap Value style, investors need a predictive rating based on (1) stocks ratings of the holdings and (2) the all-in expenses of each ETF and mutual fund. Investors need not rely on backward-looking ratings.
My fund rating methodology is detailed here.
Investors should not buy any Small-cap Value ETFs or mutual funds because none get an Attractive-or-better rating. If you must have exposure to this style, you should buy a basket of Attractive-or-better rated stocks and avoid paying undeserved fund fees. Active management has a long history of not paying off.
Get my ratings on all ETFs and mutual funds in this style on my free mutual fund and ETF screener.
Figure 1: ETFs with the Best & Worst Ratings – Top 5
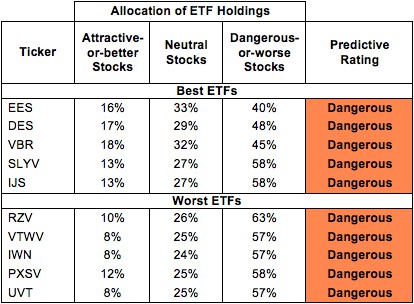 * Best ETFs exclude ETFs with TNAs less than $100 million for inadequate liquidity.
Sources: New Constructs, LLC and company filings
iShares Enhanced U.S. Small-Cap ETF (IESM), First Trust Small Cap Value AlphaDEX Fund (FYT) and Vanguard S&P Small-Cap 600 Value ETF (VIOV) are excluded from Figure 1 because their total net assets (TNA) are below $100 million and do not meet our liquidity standards.
Figure 2: Mutual Funds with the Best & Worst Ratings – Top 5
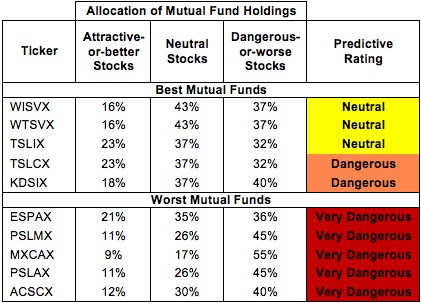
* Best mutual funds exclude funds with TNAs less than $100 million for inadequate liquidity.
Sources: New Constructs, LLC and company filings
10 mutual funds are excluded from Figure 2 because their total net assets (TNA) are below $100 million and do not meet our liquidity standards.
WisdomTree SmallCap Earnings Fund (EES) is my top-rated Small-cap Value ETF and Westcore Small-Cap Value Dividend Fund (WISVX) is my top-rated Small-cap Value mutual fund. EES earns my Dangerous rating and WISVX earns my Neutral rating. For those investors turned off by WISVX’s $500,000 initial minimum, WTSVX offers the same holdings for only slightly higher costs.
ProShares Ultra Russell2000 Value (UVT) is my worst-rated Small-cap Value ETF and American Century Capital Portfolios, Inc: Small Cap Value Fund (ACSCX) is my worst-rated Small-cap Value mutual fund. UVT earns my Dangerous rating and ACSCX earns my Neutral rating.
It is astonishing to me that no Small-cap Value ETFs or mutual funds earn an Attractive rating, as 331 out of 2,168 stocks (19% of the market value) in the style earn an Attractive-or-better rating. There are more than enough quality stocks out there for Small-cap Value ETFs and mutual funds to put together high quality portfolios.
The takeaway is: mutual fund managers allocate too much capital to low-quality stocks and Small-cap Value ETFs hold poor quality stocks.
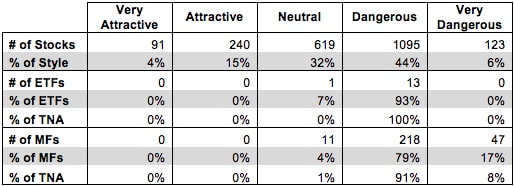
Figure 3: Small-cap Value Style Landscape For ETFs, Mutual Funds & Stocks
 Sources: New Constructs, LLC and company filings
As detailed in “Cheap Funds Dupe Investors”, the fund industry offers many cheap funds but very few funds with high-quality stocks, or with what I call good portfolio management.
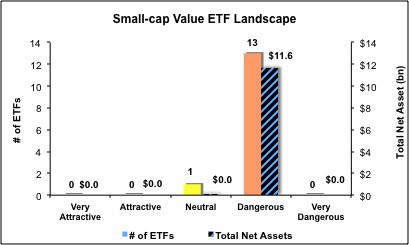
Investors should stay away from Small-cap Value ETFs and mutual funds, as 13 out of 14 Small-cap Value ETFs (almost 100% of total net assets) and 265 Small-cap Value mutual funds (99% of total net assets) earn a Dangerous-or-worse rating. Investors should focus on one of the many Attractive and Very Attractive rated stocks in this style.
World Acceptance Corp (WRLD) is one of my favorite stocks held by Small-cap Value ETFs and mutual funds and earns my Very Attractive rating. For such a small company, WRLD’s track record of profit growth is very impressive. Over the past 14 years WRLD has grown after tax profit (NOPAT) by 20% compounded annually. WRLD has not posted a year of declining NOPAT since the 1990’s. Last year it grew NOPAT by 12% while actually decreasing its invested capital by 3%, helping it to achieve a top quintile return on invested capital (ROIC) of 22%. WRLD’s small, consumer finance loans make it a lot less likely to blow up than bigger financial companies that take many more risks.
However, the market appears to be ignoring WRLD’s strong fundamentals. At its current valuation of~$90.15/share, WRLD has a price to economic book value ratio of 0.9, implying a permanent 10% decline in NOPAT. Why the market price is projecting a decline for WRLD when it has grown every year for more than a decade is beyond me, but it is great news for investors. Strong fundamentals combined with a cheap valuation make WRLD a great choice for those seeking exposure to the Small-cap Value style.
Popular Inc. (BPOP) is one of my least favorite stocks held by Small-cap Value ETFs and mutual funds and earns my Very Dangerous rating. BPOP growth in GAAP net income last year is misleading. Adjusting for factors like declining reserves and non-operating tax adjustments, BPOP’s true NOPATactually declined by nearly 40% last year. Investors should not be fooled by BPOP’s misleading accounting: its 2% ROIC and 13 years of negative economic earnings out of the past 14 reveal it to be a poorly managed company. The market appears to be falling for BPOP’s rising GAAP net income, as significant profit growth is built into its valuation. To justify its current share price of ~$28.75. BPOP must grow NOPAT by 10% compounded annually for 18 years. Despite the potential for growth in the Latin American financial market, it’s hard to justify that level of optimism for a company with as poor a track record as BPOP.
Figures 4 and 5 show the rating landscape of all Small-cap Value ETFs and mutual funds.
My Style Rankings for ETFs and Mutual Funds report ranks all styles and highlights those that offer the best investments.
Figure 4: Separating the Best ETFs From the Worst Funds
 Sources: New Constructs, LLC and company filings
Figure 5: Separating the Best Mutual Funds From the Worst Funds
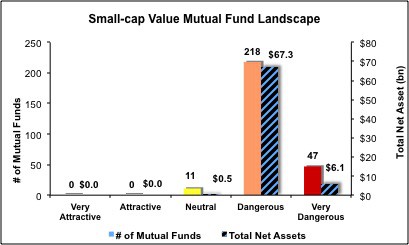
Sources: New Constructs, LLC and company filings
Review my full list of ratings and rankings along with reports on all 14 ETFs and 276 mutual funds in the Small-cap Value style.
Sam McBride contributed to this report.
Disclosure: David Trainer and Sam McBride receive no compensation to write about any specific stock, sector, style or theme.