The small-cap blend style ranks eleventh out of the twelve fund styles as detailed in my Style Rankings for ETFs and Mutual Funds report. It gets my Dangerous rating, which is based on aggregation of ratings of 21 ETFs and 648 mutual funds in the small-cap blend style as of February 13th, 2013. Prior reports on the best & worst ETFs and mutual funds in every sector and style are here.
Figures 1 and 2 show the five best and worst-rated ETFs and mutual funds in the style. Not all small-cap blend style ETFs and mutual funds are created the same. The number of holdings varies widely (from 22 to 2305), which creates drastically different investment implications and ratings. The best ETFs and mutual funds allocate more value to Attractive-or-better-rated stocks than the worst, which allocate too much value to Neutral-or-worse-rated stocks.
To identify the best and avoid the worst ETFs and mutual funds within the small-cap blend style, investors need a predictive rating based on (1) stocks ratings of the holdings and (2) the all-in expenses of each ETF and mutual fund. Investors need not rely on backward-looking ratings. My fund rating methodology is detailed here.
Investors should not buy any small-cap blend ETFs or mutual funds because none get an Attractive-or-better rating. If you must have exposure to this style, you should buy a basket of Attractive-or-better rated stocks and avoid paying undeserved fund fees. Active management has a long history of not paying off.
Get my ratings on all ETFs and mutual funds in this style on my free mutual fund and ETF screener.
Figure 1: ETFs with the Best & Worst Ratings – Top 5
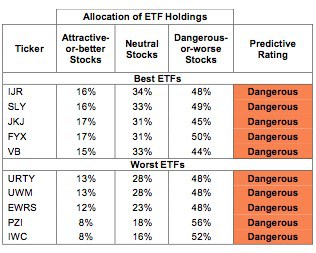 * Best ETFs exclude ETFs with TNAs less than $100 million for inadequate liquidity.
Sources: New Constructs, LLC and company filings
Five ETFs are excluded from Figure 1 because their total net assets (TNA) are below $100 million and do not meet our liquidity standards.
Figure 2: Mutual Funds with the Best & Worst Ratings – Top 5
 * Best mutual funds exclude funds with TNAs less than $100 million for inadequate liquidity.
Sources: New Constructs, LLC and company filings
Forward Funds: Forward Focus Fund (FFLFX, FLFRX) is excluded from Figure 2 because its total net assets (TNA) are below $100 million and do not meet our liquidity standards.
iShares Core S&P Small-Cap ETF (IJR) is my top-rated small-cap blend ETF and earns my Dangerous rating. Virtus Equity Trust: Virtus Quality Small-Cap Fund (PXQSX) is my top-rated small-cap blend mutual fund and earns my Neutral rating.
iShares Russell Microcap Index Fund (IWC) is my worst-rated small-cap blend ETF and earns my Dangerous rating. Pacific Advisors Fund Inc: Small Cap Value Fund (PASMX) is my worst-rated small-cap blend mutual fund and earns my Very Dangerous rating.
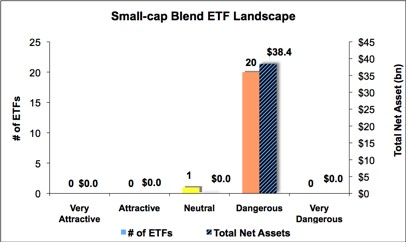
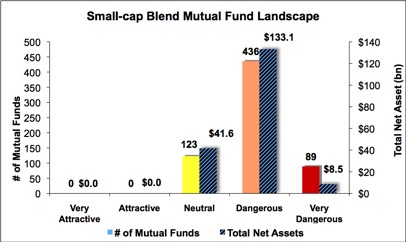
Figure 3 shows that 455 out of the 2604 stocks (over 21% of the market value) in small-cap blend ETFs and mutual funds get an Attractive-or-better rating. However, none of the 21 small-cap blend ETFs and none of the 648 small-cap blend mutual funds get an Attractive-or-better rating.
The takeaways are: mutual fund managers allocate too much capital to low-quality stocks and small-cap blend ETFs hold poor quality stocks.
Figure 3: Small-cap Blend Style Landscape For ETFs, Mutual Funds & Stocks
 Sources: New Constructs, LLC and company filings
As detailed in “Cheap Funds Dupe Investors”, the fund industry offers many cheap funds but very few funds with high-quality stocks, or with what I call good portfolio management.
Investors need to tread carefully when considering small-cap blend ETFs and mutual funds, as 95% of ETFs and 81% of mutual funds in the small-cap blend style earn a Dangerous-or-worse-rating. No ETFs or mutual funds in the small-cap blend style allocate enough value to Attractive-or-better-rated stocks to earn an Attractive rating. Focus on individual stocks instead.
Joseph A. Bank Clothiers (JOSB) is one of my favorite stocks held by small-cap blend ETFs and mutual funds and earns my Very Attractive rating. JOSB has grown after-tax profit (NOPAT) by 21% compounded annually over the past 14 years. The last year in which it failed to grow profits was 2000. This strongNOPAT growth has fueled a top quintile return on invested capital (ROIC) of 18%. Despite these positive numbers, JOSB is valued at only ~$40.10, giving it a price to economic book value ratio of 0.7. This ratio means the market is expecting a permanent decline of 30% in JOSB’s NOPAT. A market price with such low expectations combined with a strong track record of profitability means good risk/reward for investors.
United Community Banks, Inc. (UCBI) is one of my least favorite stocks held by small-cap blend ETFs and mutual funds and earns my Very Dangerous rating. UCBI had an ROIC of -19% in the last reported fiscal year. Before factoring in the weighted average cost of capital (WACC), this company is losing money for investors. UCBI’s NOPAT, which was already negative, declined by a further 150% in the last reported fiscal year. At a share price of $11.10, the market is predicting that UCBI will achieve a remarkable turnaround in profitability and growth compared to historical performance. Specifically, the current valuation of the stock implies the company will grow revenues 5% compounded annually for the next 14 years while also raising its ROIC from -19% to 10%. Those expectations seem like a stretch for a company whose ROIC and economic earnings have declined four out the past five years.
Figures 4 and 5 show the rating landscape of all small-cap blend ETFs and mutual funds.
My Style Rankings for ETFs and Mutual Funds report ranks all styles and highlights those that offer the best investments.
Figure 4: Separating the Best ETFs From the Worst Funds
 Sources: New Constructs, LLC and company filings
Figure 5: Separating the Best Mutual Funds From the Worst Funds
 Sources: New Constructs, LLC and company filings
Review my full list of ratings and rankings along with reports on all 21 ETFs and 648 mutual funds in the small-cap blend style.
Sam McBride contributed to this report.
Disclosure: David Trainer and Sam McBride receive no compensation to write about any specific stock, sector or theme.