The Utilities sector ranks ninth out of the ten sectors as detailed in my Sector Rankings for ETFs and Mutual Funds report. It gets my Dangerous rating, which is based on aggregation of ratings of 8 ETFs and 33 mutual funds in the Utilities sector as of July 10, 2013. Prior reports on the best & worst ETFs and mutual funds in every sector and style are here.
Figure 1 ranks from best to worst all eight Utilities ETFs and Figure 2 shows the five best and worst-rated Utilities mutual funds. Not all Utilities sector ETFs and mutual funds are created equal. The number of holdings varies widely (from 20 to 79), which creates drastically different investment implications and ratings. The best ETFs and mutual funds allocate more value to Attractive-or-better-rated stocks than the worst ETFs and mutual funds, which allocate too much value to Neutral-or-worse-rated stocks.
To identify the best and avoid the worst ETFs and mutual funds within the Utilities sector, investors need a predictive rating based on (1) stocks ratings of the holdings and (2) the all-in expenses of each ETF and mutual fund. Investors need not rely on backward-looking ratings. My fund rating methodology is detailed here.
Investors should not buy any Utilities ETFs or mutual funds because none get an Attractive-or-better rating. If you must have exposure to this sector, you should buy a basket of Attractive-or-better rated stocks and avoid paying undeserved fund fees. Active management has a long history of not paying off.
Get my ratings on all ETFs and mutual funds in this sector on my free mutual fund and ETF screener.
Figure 1: ETFs with the Best & Worst Ratings
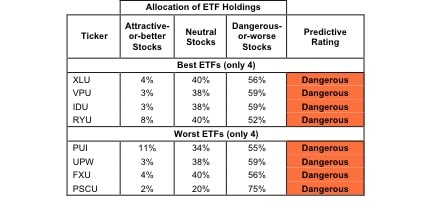 * Best ETFs exclude ETFs with TNAs less than $100 million for inadequate liquidity.
Sources: New Constructs, LLC and company filings
Figure 2: Mutual Funds with the best & Worst Ratings -- Top 5
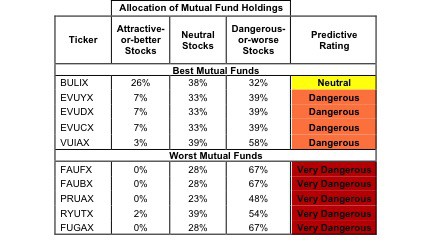
* Best mutual funds exclude funds with TNAs less than $100 million for inadequate liquidity.
Sources: New Constructs, LLC and company filings
ICON Utilities Fund (ICTUX) is excluded from Figure 2 because its total net assets (TNA) are below $100 million and do not meet our liquidity standards.
Utilities Select Sector SPDR (XLU) is my top-rated Utilities ETF and American Century Quantitative Equity Utilities Fund (BULIX) is my top-rated Utilities mutual fund. XLU receives my Dangerous rating, while BULIX manages a Neutral rating.
PowerShares S&P Small Cap Utilities Portfolio (PSCU) is my worst-rated Utilities ETF and Fidelity Advisor Utilities Fund (FUGAX) is my worst-rated Utilities mutual fund. PSCU receives my Dangerous rating, while FUGAX gets my Very Dangerous rating.
Figure 3 shows that 12 out of the 138 stocks (over 4% of the market value) in Utilities ETFs and mutual funds get an Attractive-or-better rating. However, none of the 8 Utilities ETFs or 33 mutual funds get an Attractive-or-better rating.
The takeaways are: mutual fund managers allocate too much capital to low-quality stocks and Utilities ETFs hold poor quality stocks.
Figure 3: Utilities Sector Landscape For ETFs, Mutual Funds & Stocks
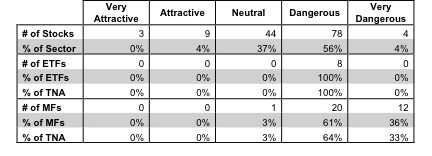
Sources: New Constructs, LLC and company filings
As detailed in “Low-Cost Funds Dupe Investors”, the fund industry offers many cheap funds but very few funds with high-quality stocks, or with what I call good portfolio management.
Investors need to tread carefully when considering Utilities ETFs and mutual funds, as only one of these funds manages to earn above a Dangerous rating. No ETFs or mutual funds in the Utilities sector allocate enough value to Attractive-or-better-rated stocks to earn an Attractive rating. Investors should focus on individual Utilities stocks instead.
Though three stocks held by Utilities ETFs and mutual funds earn a Very Attractive rating, none of these are actually Utilities companies. Consolidated Edison (ED) is my highest-rated Utilities stock and earns my Attractive rating. The low returns on invested capital (ROIC) of most Utilities stocks can make it difficult for investors to pick out the cream of the crop, and while ED’s 5% figure might seen low, its lower cost of capital (WACC) of 4% ensures that the firm is still earning positive economic earnings. Moreover, ED has increased profits (NOPAT) by 12% compounded annually since 2004.
Even though ED is near the top of its sector in terms of efficiency and growth, the stock is still trading with a price to economic book value ratio of 0.8, which means that the market expects its profits to decline by 20%. ED’s profits have not declined in over 8 years, and its ROIC has only increased, so this decline looks unlikely. Last November, I saw reduced risk related to ED’s growing pension liabilities and upgraded the stock from Dangerous to Neutral. The stock bottomed out around $54/share in November and has only risen slightly since then to ~57/share. I suggest investors jump on now while there is plenty of room for the stock to rise.
Duke Energy (DUK) is one of my least favorite stocks held by Utilities ETFs and mutual funds and earns my Dangerous rating. DUK has grown profits (NOPAT) at only 2% compounded annually since 2000, and has earned negative economic earnings for the last 8 years as well. DUK also has a return on invested capital (ROIC) of 4%, putting it in the bottom quintile of all companies I cover. Although investors have begun to lose confidence in DUK and the stock price has trended downward since 2000, DUK still trades at ~$68.48/share. To justify its current price, DUK would need to grow NOPAT by 8% compounded annually for the next 4 years. Seeing as Duke has barely managed to grow it profits by 2% each year for over 10 years, these expectations are a high and I would advise investors to stay away from this stock.
85 stocks of the 3000+ I cover are classified as Utilities stocks, but due to style drift, Utilities ETFs and mutual funds hold 138 stocks.
Figures 4 and 5 show the rating landscape of all Utilities ETFs and mutual funds.
My Sector Rankings for ETFs and Mutual Funds report ranks all sectors and highlights those that offer the best investments.
Figure 4: Separating the Best ETFs From the Worst ETFs
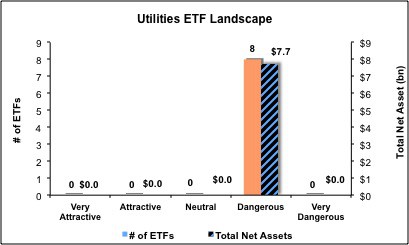
Sources: New Constructs, LLC and company filings
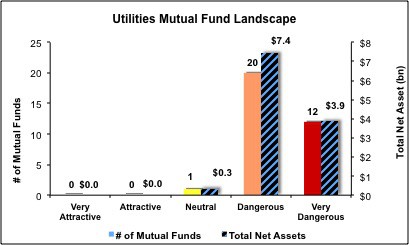
Figure 5: Separating the Best Mutual Funds From the Worst Mutual Funds
Sources: New Constructs, LLC and company filings
Review my full list of ratings and rankings along with reports on all 8 ETFs and 33 mutual funds in the Utilities sector.
André Rouillard and Sam McBride contributed to this report.
Disclosure: David Trainer, André Rouillard and Sam McBride receive no compensation to write about any specific stock, sector or theme.