The price of oil and of gold are daily fodder for the financial media. Lately, minute-by-minute fluctuations in the value of the commodities have been followed breathlessly by pundits and punters, looking for either prophesy or profit. But pull back a little. There’s a relationship between gold and oil that’s worth understanding because each, being valued in U.S. dollars, putatively serves as a measure of inflation.

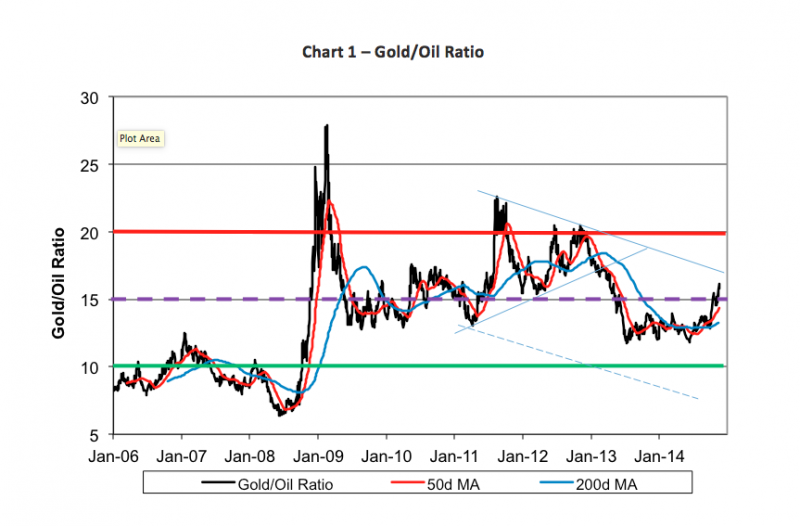
And, since both commodities have a common denominator, it’s easy to price one against the other. Ergo, the gold/oil ratio—the price of gold expressed in barrels of crude. In the modern era, it’s averaged 15-to-1, meaning one ounce of gold buys 15 barrels. That’s an average, mind you. There have been serious excursions in either direction. In the summer of 2008, for example, oil headed to record heights tamping down the multiple to 6x. Just nine months later, the ratio rocketed above 27-to-1. And, then? A fall back to the historic average.
That roller coaster ride provided savvy—and nervy—traders several profit opportunities. There is, for example, a spread recognized between Comex gold and cash-settled Nymex oil futures contracts. In one trade, one could have bought gold and sold oil to ride the ratio skyward, then flipped the trade over to surf the ensuing plunge. Less adventurous bettors could have used exchange-traded funds and notes in their securities accounts.
Why bring this up now? Hindsight is always 20/20, but forecasts? Well, they tend to be murky. But look at the current ratio in Chart 1. We’ve got our first foray above the 15-to-1 average in over a year. That leads us to two questions: Is gold getting pricey or is oil too cheap? In either case, what does one do about it?
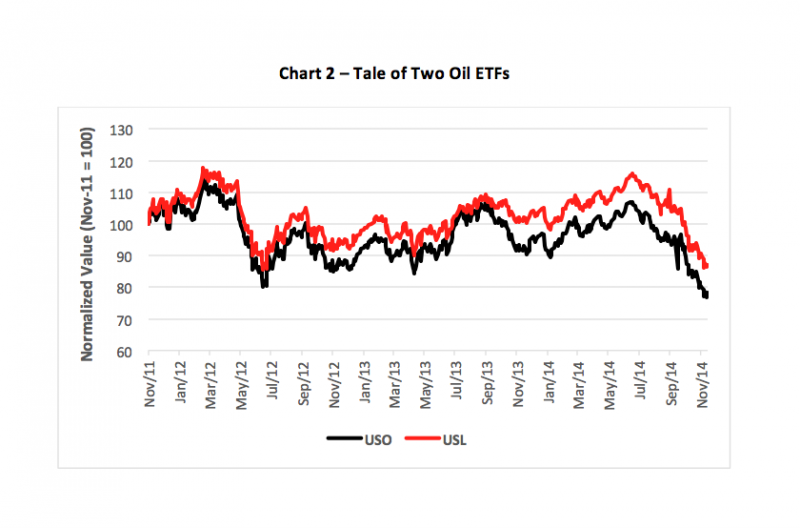
If you’re in the ‘oil is cheap’ camp, you’ve got more than a few exchange-traded product plays possible. Two of the most popular are portfolios issued by US Commodity Funds—the United States Oil Fund (NYSE Arca: USO) and the United States 12-Month Oil Fund (NYSE Arca: USL). Each fund invests in Nymex futures contracts.
So what’s the difference? Contango. Or, rather, the suppression of contango’s deleterious effect. Contango describes the futures price curve when later-dated contracts, say those calling for March 2015 deliveries, are more expensive than near-term futures, such as those requiring settlement by December 2014.
The USO fund invests in only near-term contracts and, thus, requires constant “rolls” to maintain exposure. When the oil market’s in contango, the constant sale of cheaper expiring contract and the purchase of higher-priced replacement futures, i.e., “buying high, selling low,” produces a negative roll yield, eroding profits and magnifying losses.
USL, on the other hand, spreads its exposure out over the nearest 12 delivery months, thus minimizing the effect of each monthly roll. The result? Less volatility and better overall returns. You can see the impact in Chart 2.

It’s more than buying cheap oil. It’s about buying the right ETF for the job.
Brad Zigler is former head of marketing and research for the Pacific Exchange's (now NYSE Arca) option market and the iShares complex of exchange traded funds.